
Platinum Stock Supply Crisis.
The Truth Revealed.
by Dr. David Davis
CLICK HERE to download the full report
We are pleased to offer the latest research report by Dr. David Davis, which emphasizes the significance of incorporating import and export data along with above-ground inventory (AGI) when forecasting platinum market trends, evaluating the overall market balance, and determining prices ceteris paribus. This study, ongoing since 2017, provides compelling evidence supporting the contention about the magnitude of AGIs both globally and regionally.
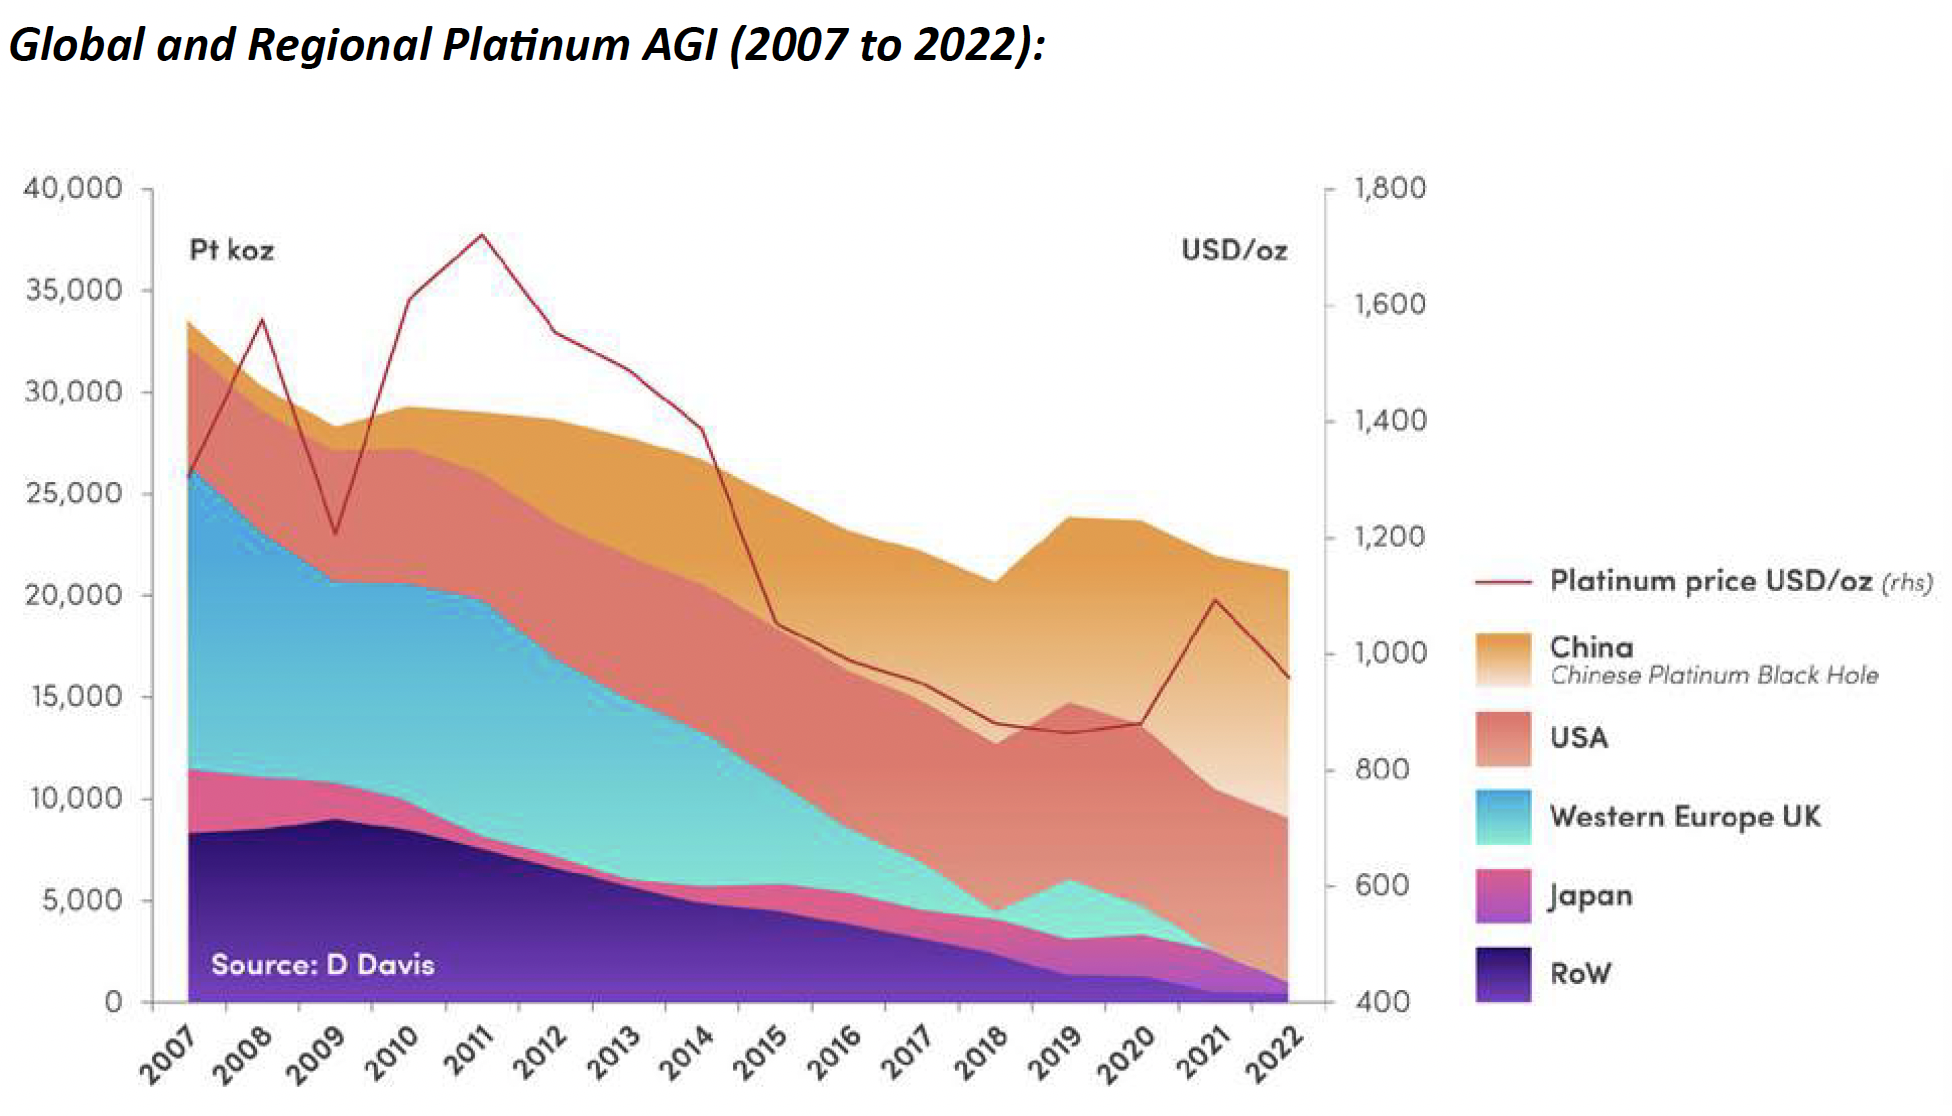
The most extreme example of regional platinum import and export dislocation relates to China, which only imports platinum and does not export platinum. In addition, China has been importing more platinum than its actual demand since 2009. The AGI in China is widely accepted as being a ‘black hole’ and as such the AGI is not globally mobile. My calculations indicate that the quantum of China’s AGI is around ~12moz (2022). Furthermore, it is likely that China will continue to suck platinum out of the system. In contrast, my research implies that Western Europe plus UK, Japan and the Rest of the World have been destocking their platinum AGIs at pace between 1993 and 2022.
For Western Europe and the UK, the platinum AGI has diminished into negative territory (the red zone) and the Rest of the World is about to follow. Western Europe plus the UK are considered the hubs of automotive platinum demand (according to the World Platinum Investment Council). Over the same period, the USA has built its platinum AGI to some ~8moz and Japan’s AGI was around ~1.8moz in 2022. This description is illustrated below.
The description and calculation of the regional movement and quantum of platinum AGIs over time goes a long way to confirm my contention that import and export data together with the AGIs provide important and quantifiable information. I argue that the simple platinum supplyand-demand equation, which has been used for at least half a decade by many PGM research organisations such as Johnson Mathey (JM), SFA Oxford, (SFA), Metals Focus (MF), World Platinum Council (WPIC) and the CPM group forecasts “is not fit for purpose”. These organisations are forced to rely on estimates of AGIs, and furthermore, do not know their quantum or regional location.
Under these circumstances, this simple equation has been misused and misreported and is both misleading and confusing to the platinum industry and investment community. It does not reflect the real platinum market balance equation: where the true Market Balance = (Imports –Demand) – Exports. 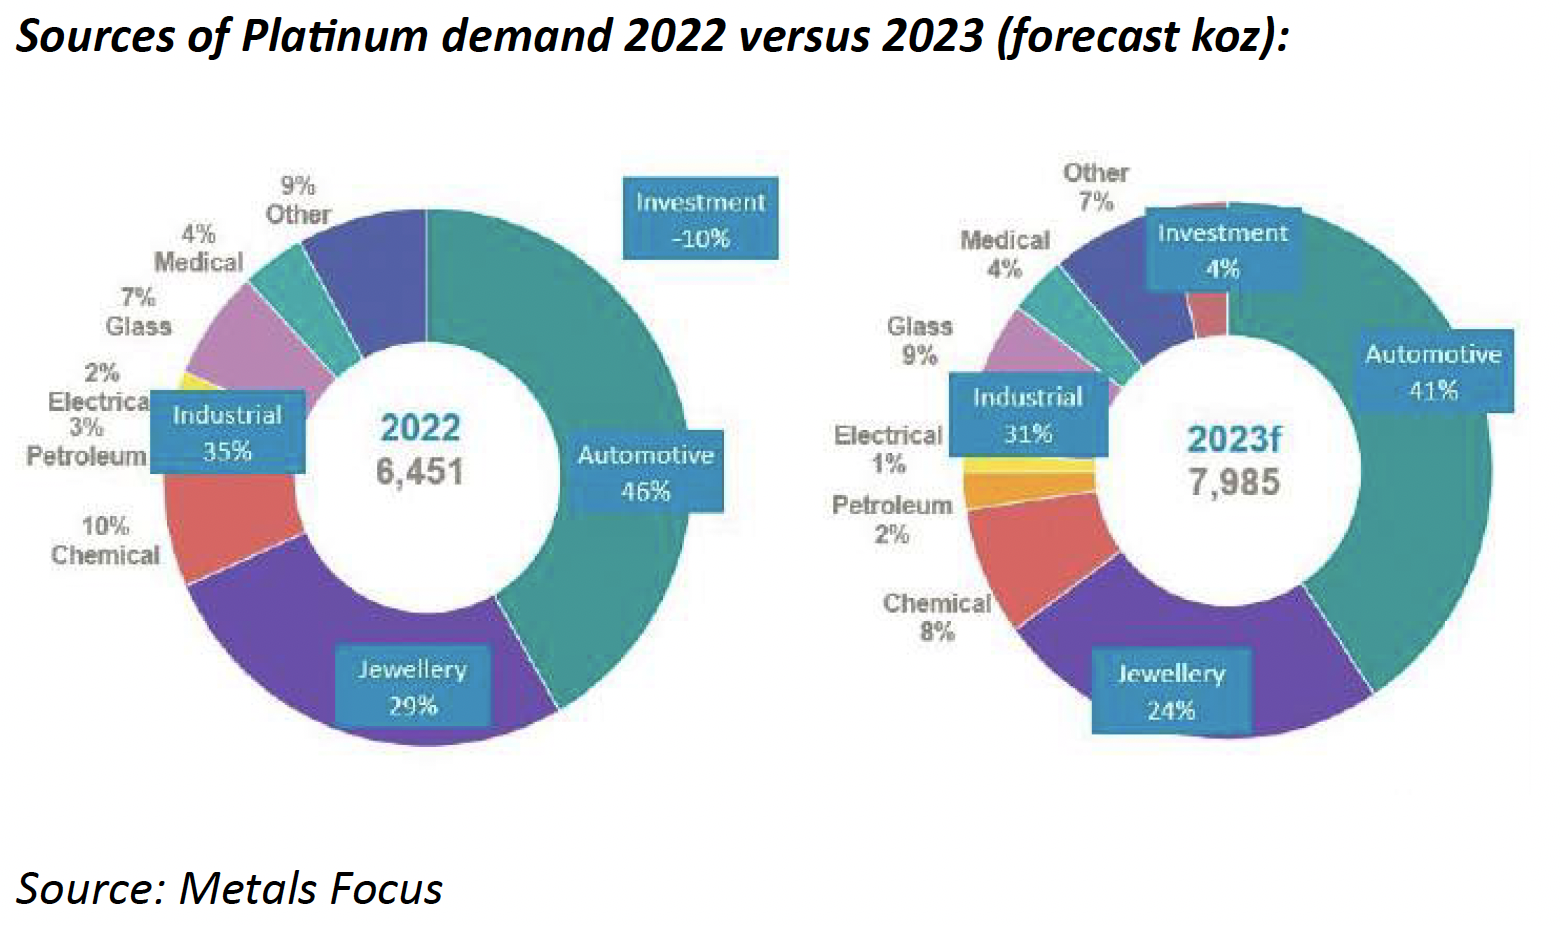
My calculations imply that the platinum quantum of the AGI in Western Europe and the UK have entered a critical red zone. Support can only come from the USA’s AGI, at a price; or from an increase in primary mine supply, which is in decline; or from a significant increase in recycling, which is unlikely. These trends I therefore expect to ignite the price of Platinum within the next few months.
The Real Market Balance Versus The Simple Supply-and-Demand Market Equation for Platinum
In this conversation, I compare the elements applied in the real platinum market balance equation with a simple platinum supply-and-demand equation, which has been used for at least half a decade by PGM research organisations.

By way of an elementary explanation both the real and simple equations may result in positive or negative market balances to various levels. A positive balance (market surplus) reflects an increase in global market stocks + Above Ground Inventories (AGIs). Under these circumstances, platinum is available to the market and in this environment the incentive for upward pressure on the platinum price is relatively low, ceteris paribus, whereas a negative balance (market deficit) indicates a decrease in market balance. In this regard, the stocks ( -AGIs) will have to be mobilised, at a price, to balance the market. I note that a certain portion of these stocks are ‘sticky’, and that investors are not selling into the market but are holding out for a higher platinum price.
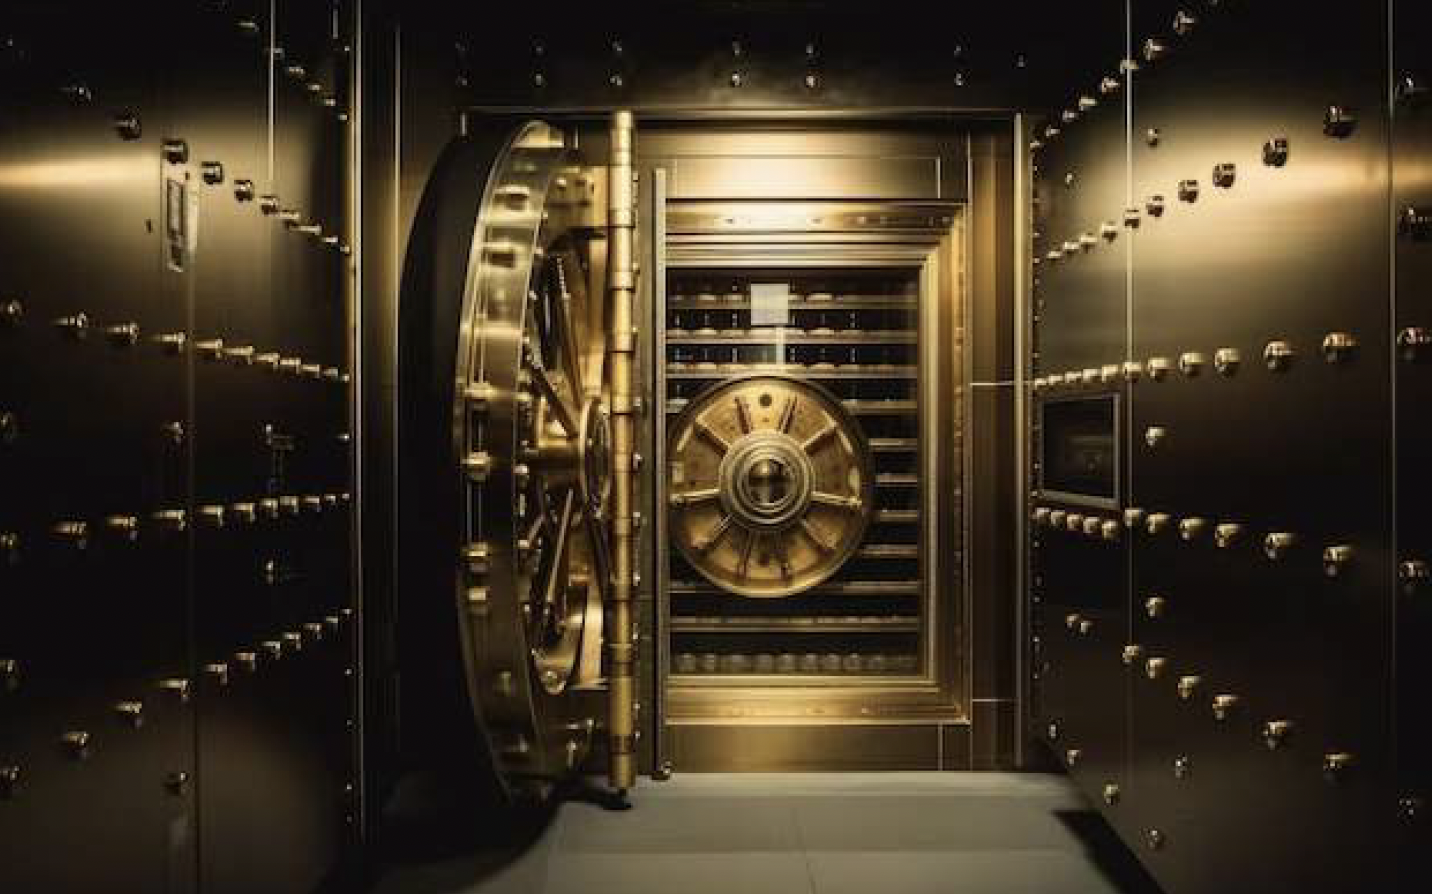
Platinum AGIs are finite and in time will ultimately be unable to topup and support metal supply in an environment of increases in both demand and price. I argue that the geographic location and mobility of vaulted stocks (AGI) is an important factor when considering the metal’s supply life and price.
A schematic representation of the elements applied to derive the real market balance and the simple equation are illustrated below. It should be noted that the real market balance uses quantifiable information except for demand, which is supplied by PGM research organisations.
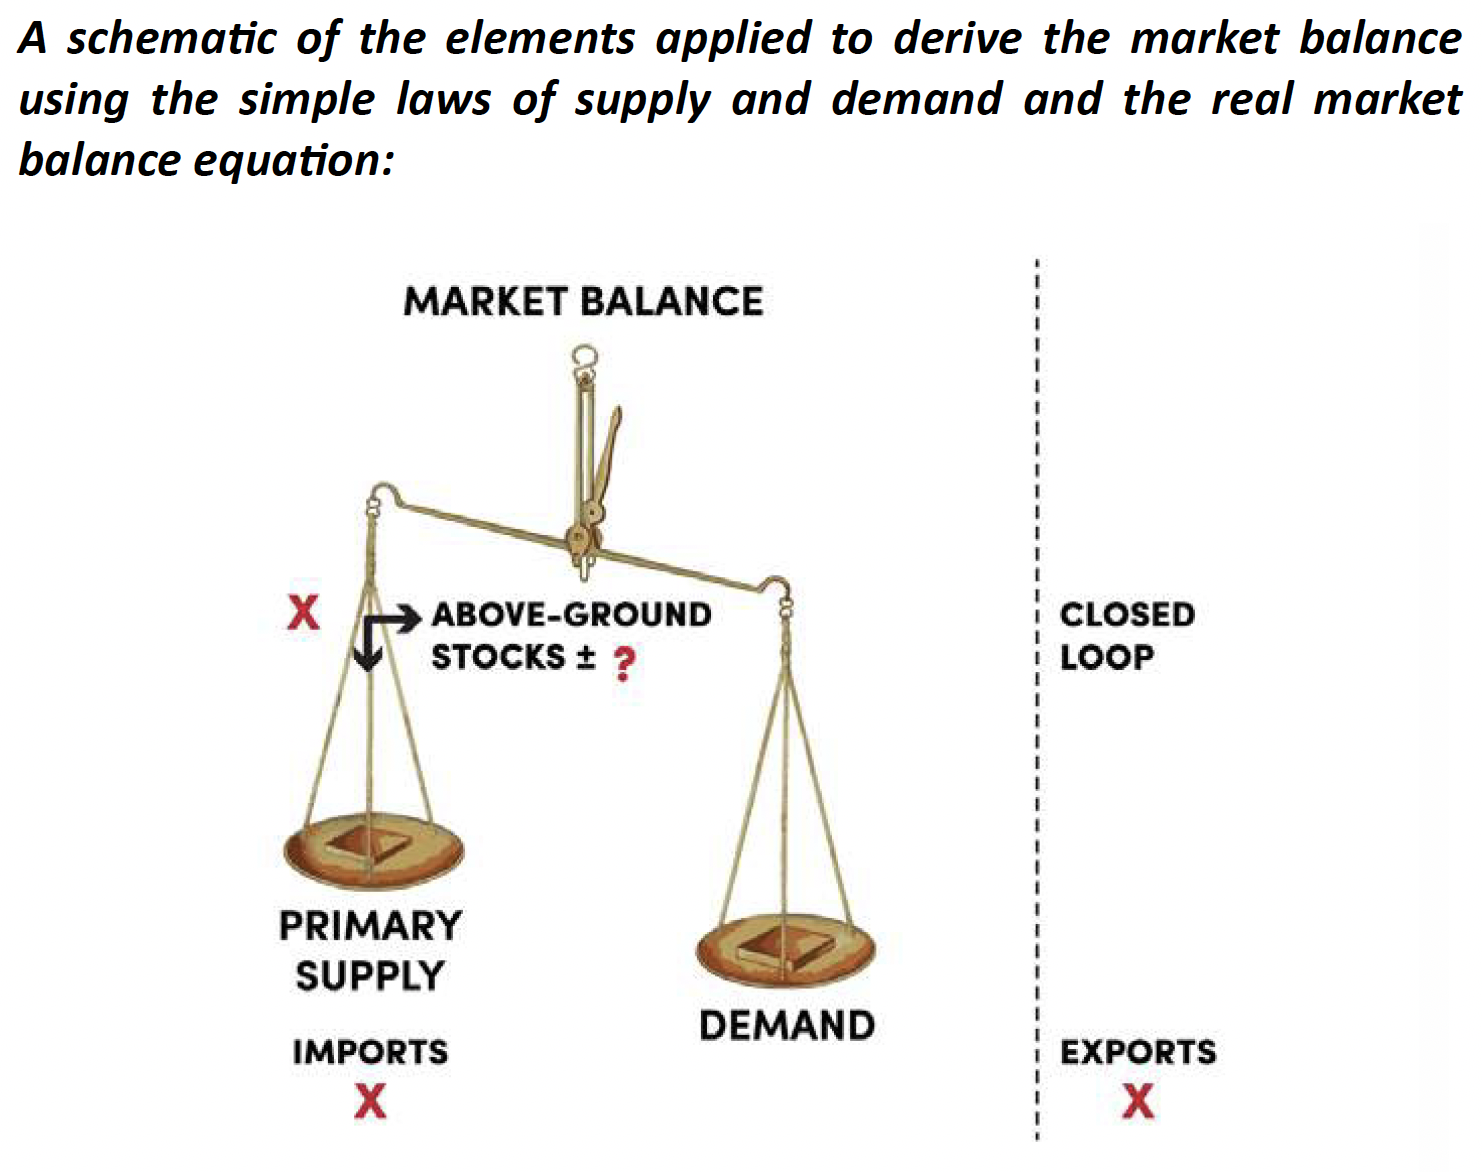
Research organisations do not collect data on platinum imports and exports, nor do they attempt to calculate the quantum of AGI on a global and regional basis. Yet, they conduct detailed strategic analysis on the platinum AGI, an unknown and estimated quantum!
The real platinum market balance equation can only be applied provided that the imports and exports are regionally quantified, in this regard the quantum of AGI can be calculated, as illustrated below:
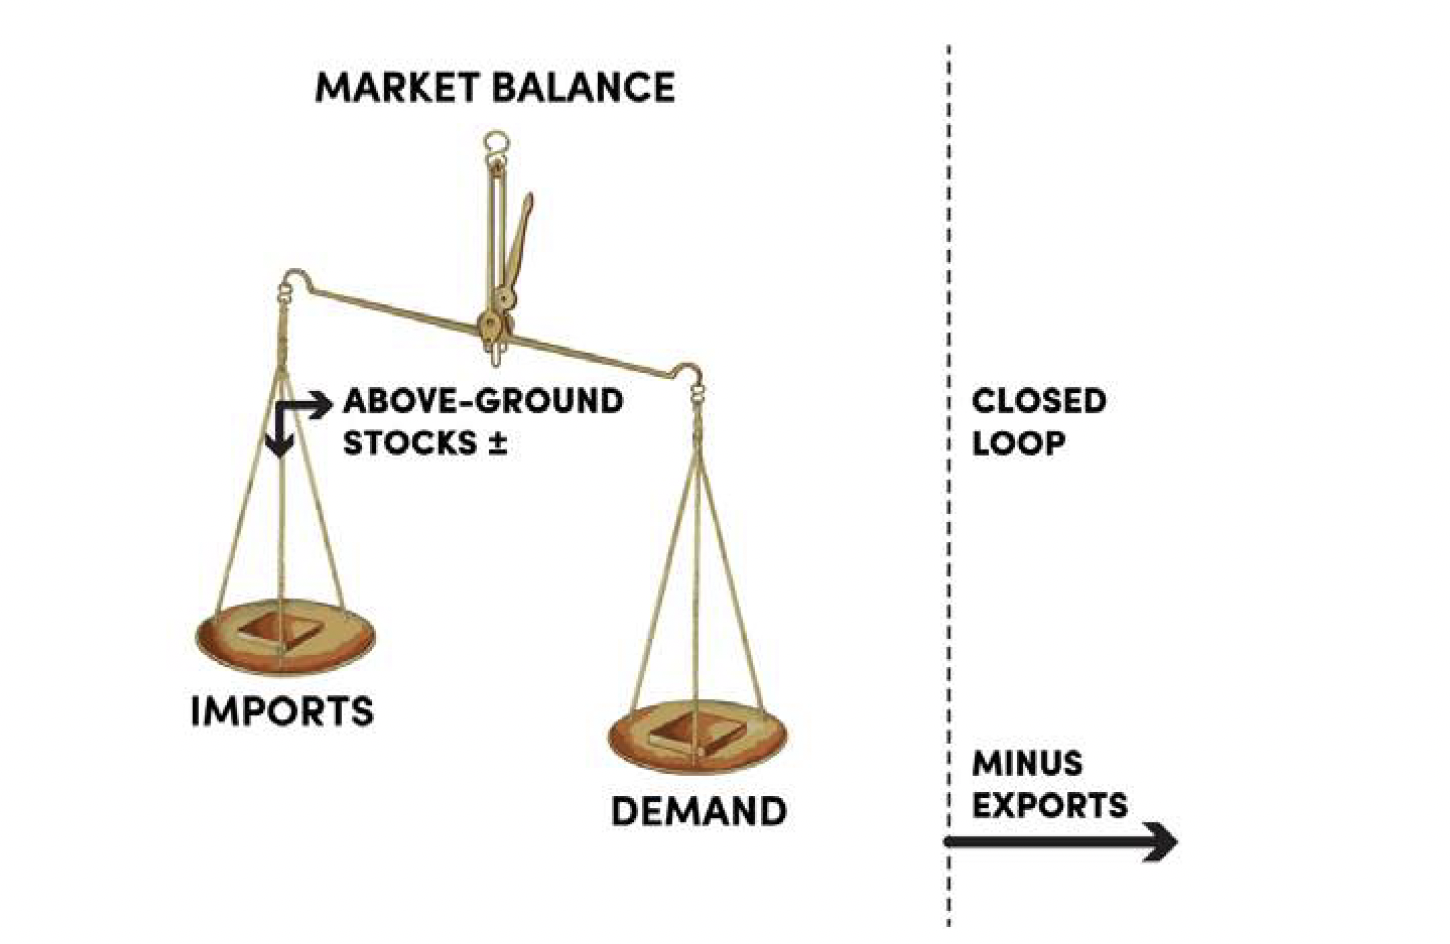
The principal driver of both these market balance equations is the quantum and degree of liquidity of AGIs.
All major research organisations are forecasting that platinum is heading into a deficit in 2023 as a result of rapidly increasing demand, which is not matched by a primary supply increase and, under these circumstances, are forecasting deficits every year to at least 2032. (Even ignoring China’s additional import data).
This real situation will have a major and very positive impact on the price of platinum.
As indicated in my most recent report, my calculations imply that the platinum quantum of the AGI in Western Europe and the UK have entered a critical red zone. Support can only come from the USA’s AGI, at a price; from an increase in primary mine supply, which is in medium-term decline; or from a significant increase in recycling, which is unlikely, ceteris paribus. These trends are set to ignite the platinum price within the next few months.
Additional Platinum Imports into China a Conundrum for Research Organisations
My research implies that the quantum of platinum imports into China (and via Hong Kong into China) have exceeded demand since 2009. Consequently, there is evidence of increased activity in strategic investment in platinum by the Chinese government and/or investment holdings.
Much has been written by research organisations since China was reported to be importing additional platinum, most of which has been based on supposition, estimates and confusion surrounding interpretation. It is in this regard that I initially focused on the additional platinum imports into China using this as an example to demonstrate the inadequacy of the simple law of supply and demand.
Evidence from the literature supports and adds credibility to my assertions. Recent articles published by the World Platinum Investment Council (WPIC), JM and Heraeus provide substantive evidence. WPIC Platinum Perspectives (February 2022), commented that “China’s platinum imports have been continuing to run well ahead of identified demand, with ‘excess/unexplained’ imports totalling ~1.3moz in 2021, well in excess of the estimated global platinum surplus of 769koz”. Heraeus commented in its precious metal appraisal No. 6 (28 February 2022) that “opportunistic platinum purchases from China resulted in record imports last year”.
Trevor Raymond (now CEO of WPIC) said in an interview with Mining Weekly (9 March 2022): “We don’t yet have the China import data for January 2022, but it certainly looks like that with elevated lease rates, and the reduction in NYMEX stocks suggests that China will continue to import more than it uses. A very big driver that puts a ‘bit of a contradiction’ into a market that’s in massive surplus (2021), yet the market is tight.’’ JM reported similar observations “while our figures show the platinum market in oversupply, trends in lease rates suggest that availability in Western markets tightened last year. It is likely that much of the surplus metal was acquired by Chinese market participants”.
It seems that in this case, market reality does not correspond with the market balance derived from the simple supply-and-demand equation. Furthermore, how do the research organisations deal with China purchasing platinum in excess of demand?
They clearly face a conundrum in deciding if they should include the additional platinum imports in the simple market balance equation or should leave them out of the equation. Leaving the additional platinum imports out of the simple equation maintains the research organisations’ status quo; however, including the additional excess imports results in a significant global platinum deficit.
It seems that the research organisations have elected not to include the additional platinum imports in the market balance equation, a ‘’folly’’ which is likely to mislead those who interpret the equations. The WPIC’s view is that “without an identified end use, the flow of excess China imports is not captured in our supply-demand analyses yet falling NYMEX stocks are.
I argue that these additional inputs have an identifiable use, and the purpose is to build-up Above Ground Inventories (AGIs) in China.
Reliance on the simple law of supply-and-demand has become the ‘Holy Grail’ of the PGM industry. Unfortunately, the ‘status quo’ thus far remains, leaving the platinum industry and investors in the dark.
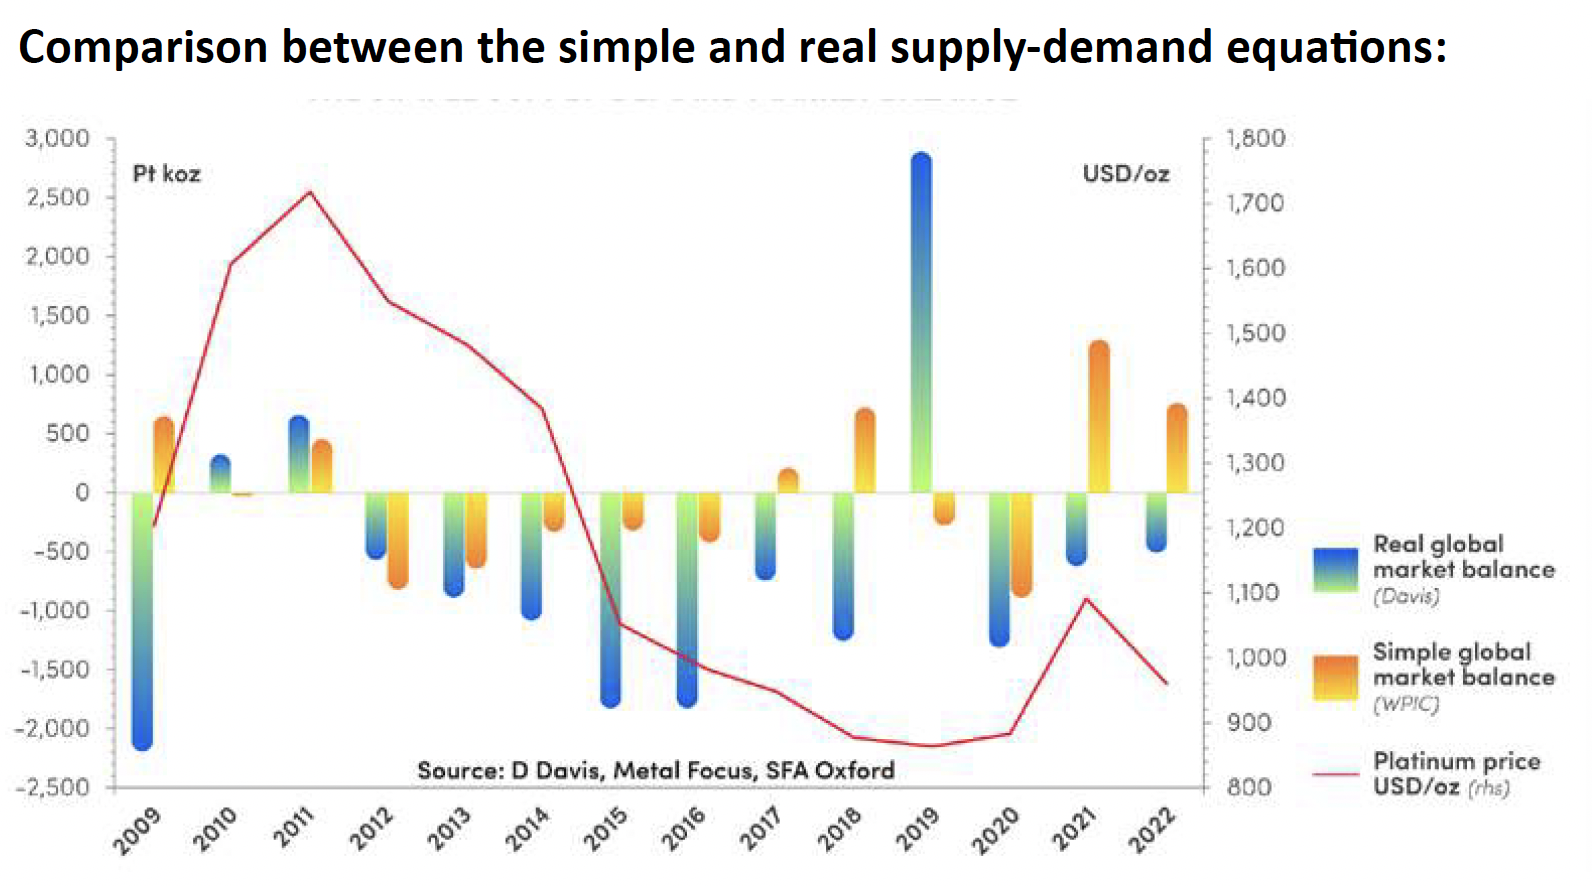
The global comparison between the simple and real supply-demand equations is illustrated by the above. Note, the real market balance equation implies a large market deficit in 2021 and 2022 whereas, the simple equation which excludes China predicts a large platinum surplus. This result represents an example of PGM research organisations misleading the platinum industry and investment community.
Large deficits recorded by the real market balance between 2012 and 2014 are attributed to production losses on the South African PGM mines due to legal and illegal strikes, safety stoppages and closure of some marginal mining operations.
How much platinum has China imported in excess of demand?
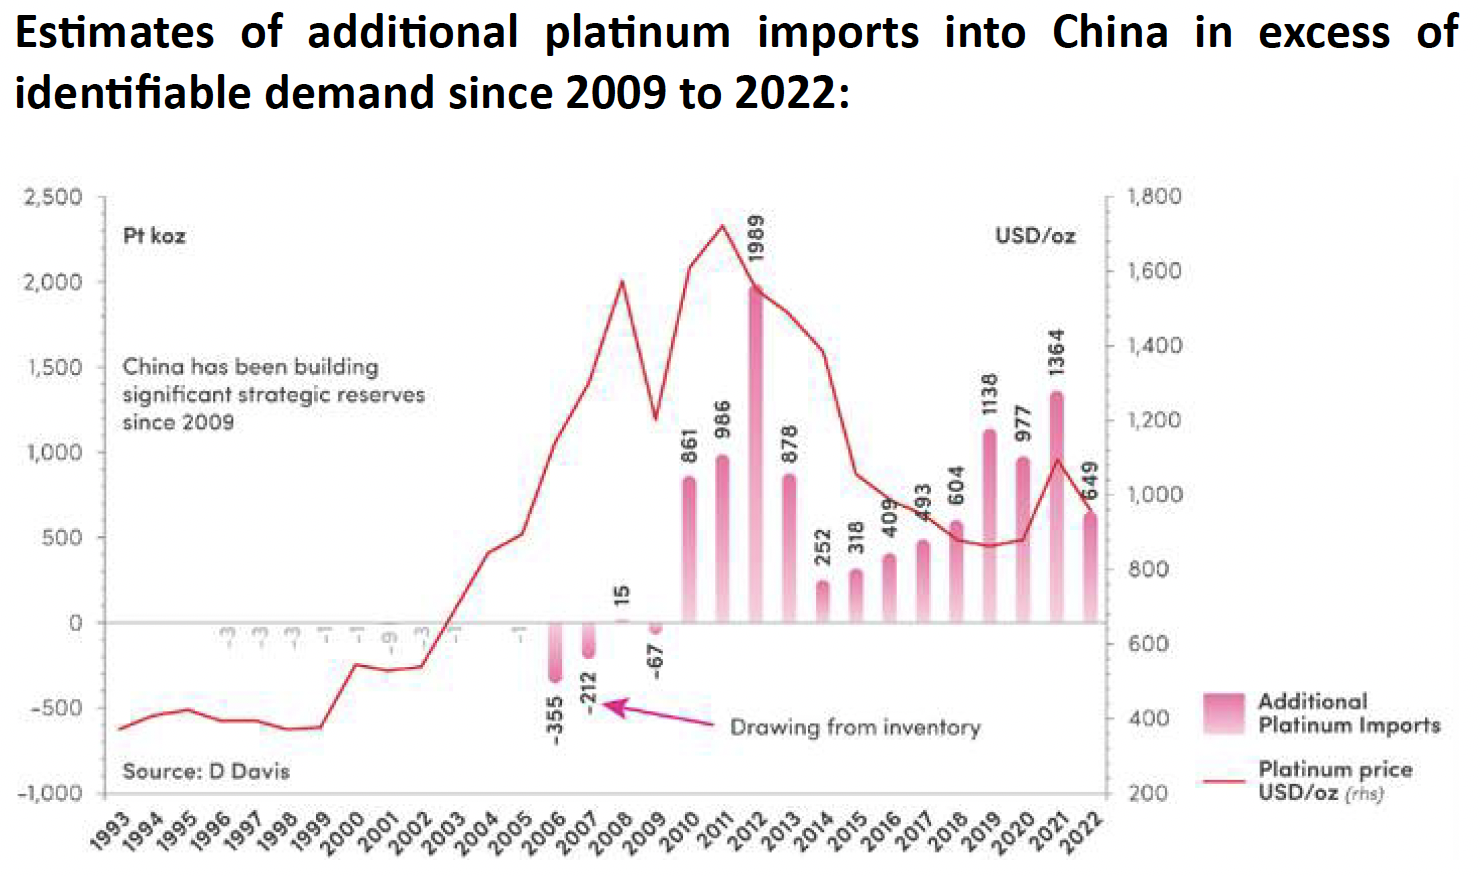
My research implies that the quantum of platinum imports into China (and via Hong Kong into China) have exceeded demand since 2009. Consequently, there is evidence of increased activity in strategic investments in platinum by the Chinese government and/or in investment holdings. The Figure below illustrates this activity between 2009 and 2022. There does not seem to be a strong relationship between the quantum of additional platinum imports into China strongly suggesting that it is a strategic political investment decision.
The frequency of additional purchases of platinum in excess of demand since 2009 is illustrated by the Figure below. My calculations indicate that around ~12moz has been accumulated as of 2022. In a recent report, the WPIC (Platinum perspectives 11 October 2022) quoted Bloomberg, which sourced customs data for China which indicated China has imported more than ~4moz of platinum in excess of identified demand since 2019. This quantum of platinum coincides with my figure of around ~4.1moz. My calculations also imply an excess in imports of ~1.3moz in 2021, which is similar in value to the platinum quantum reported by the WPIC in 2021. Again, these statements go a long way in supporting my assertions regarding the importance of assessing estimates of import and export data when forecasting market balance trends and the platinum price.
It should be noted that China does not export platinum. The AGI in China is widely accepted as being a ‘black hole’ and such inventory is therefore not globally mobile. In this regard, the AGI in China will likely continue to build up. This contrasts with the destocking (exports) and redistribution of platinum AGI between Western Europe UK, USA, Japan and the rest of the world.
It is apparent, however, that the WPIC and other research organisations do not fully grasp nor accurately detail the extent of China’s AGI. Furthermore, they do not know the regional distribution or the quantum platinum of the AGI.
At this point of the discussion it is important to restate my contention that import and export data together with AGI provide important and quantifiable information to consider when forecasting market trends, the overall market balance and the price (of platinum), ceteris paribus. The real platinum market balance equation can be applied provided that the imports and exports are regionally quantified, in this regard, the quantum of AGIs can be calculated. Almost all of the illustrations detailed in my research apply the real platinum market balance equation, and the importance of these additional factors in the discussion of this review will become obvious to the reader.
The Figure below illustrates the apparent and actual global AGI. The apparent AGI includes China’s AGI, whereas the actual AGI excludes China’s AGI. The area between the two AGIs represents the Chinese ‘black hole’. It shows that the actual global platinum AGI is declining at a pace, spurred on by the quantum of additional imports into China. My calculations indicate that by 2022 China’s AGI had grown to around ~12moz, which represents ~57% of the apparent global platinum AGI of 21.2moz. It is interesting to note that the WPIC reported platinum imports into China over demand, and its ‘estimated’ impact on AGI, which amounted to some ~80% of total AGI.
The apparent global and the actual AGI which includes China’s AGI: 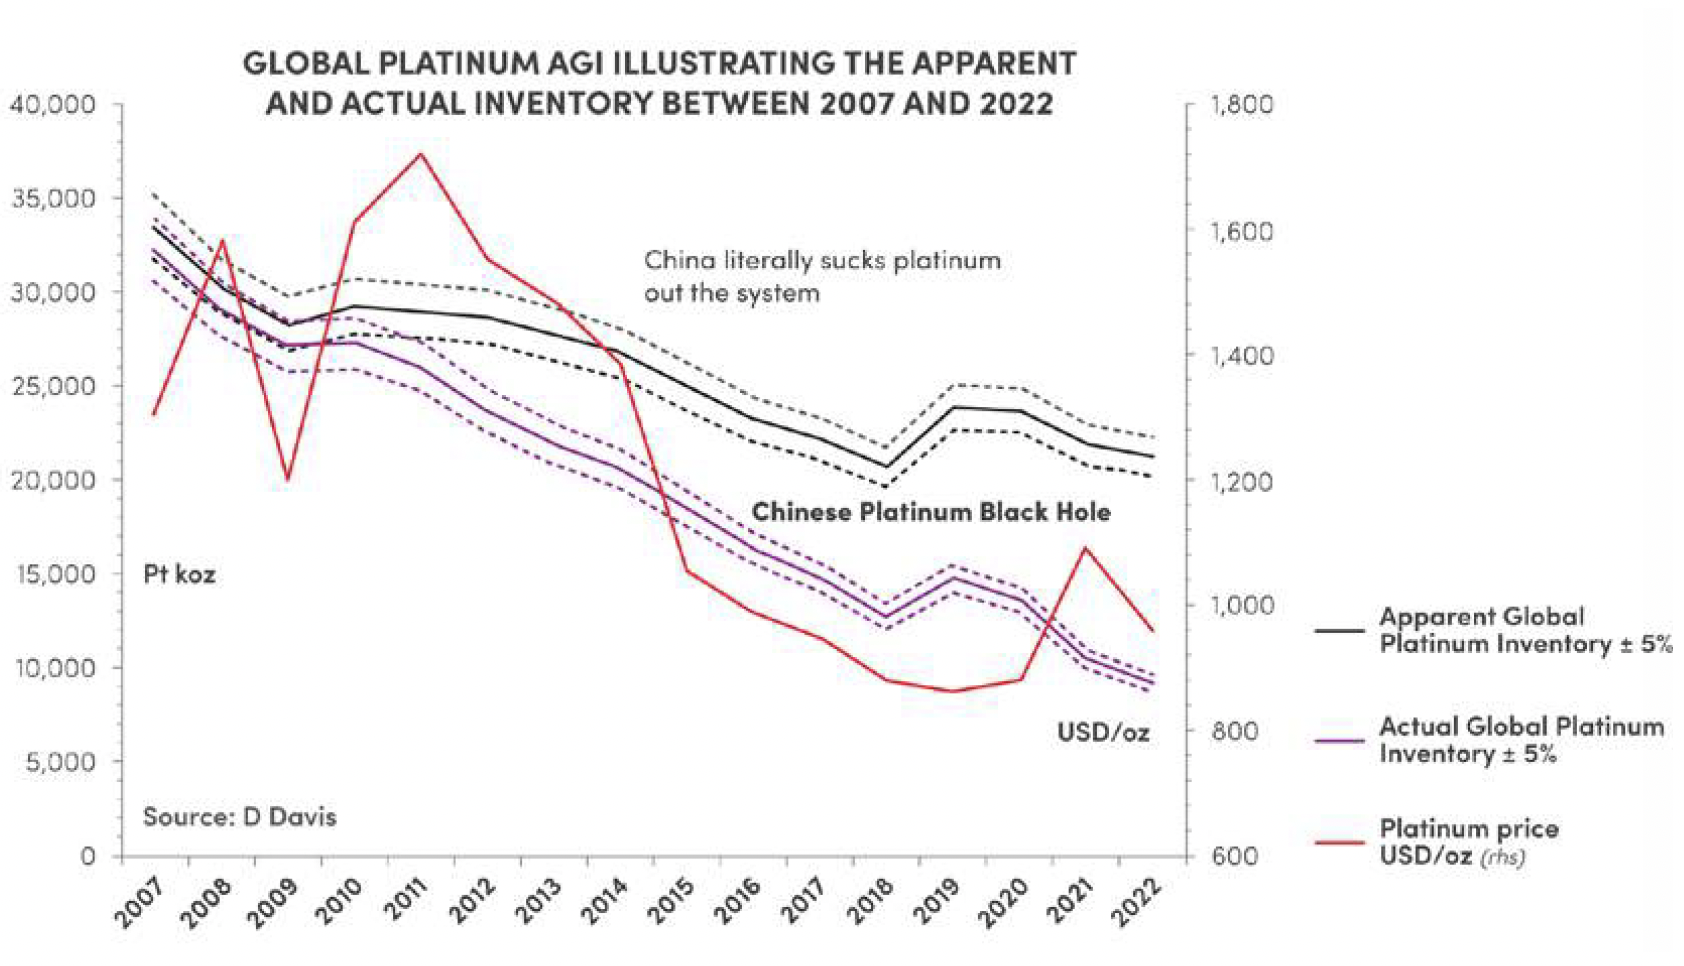
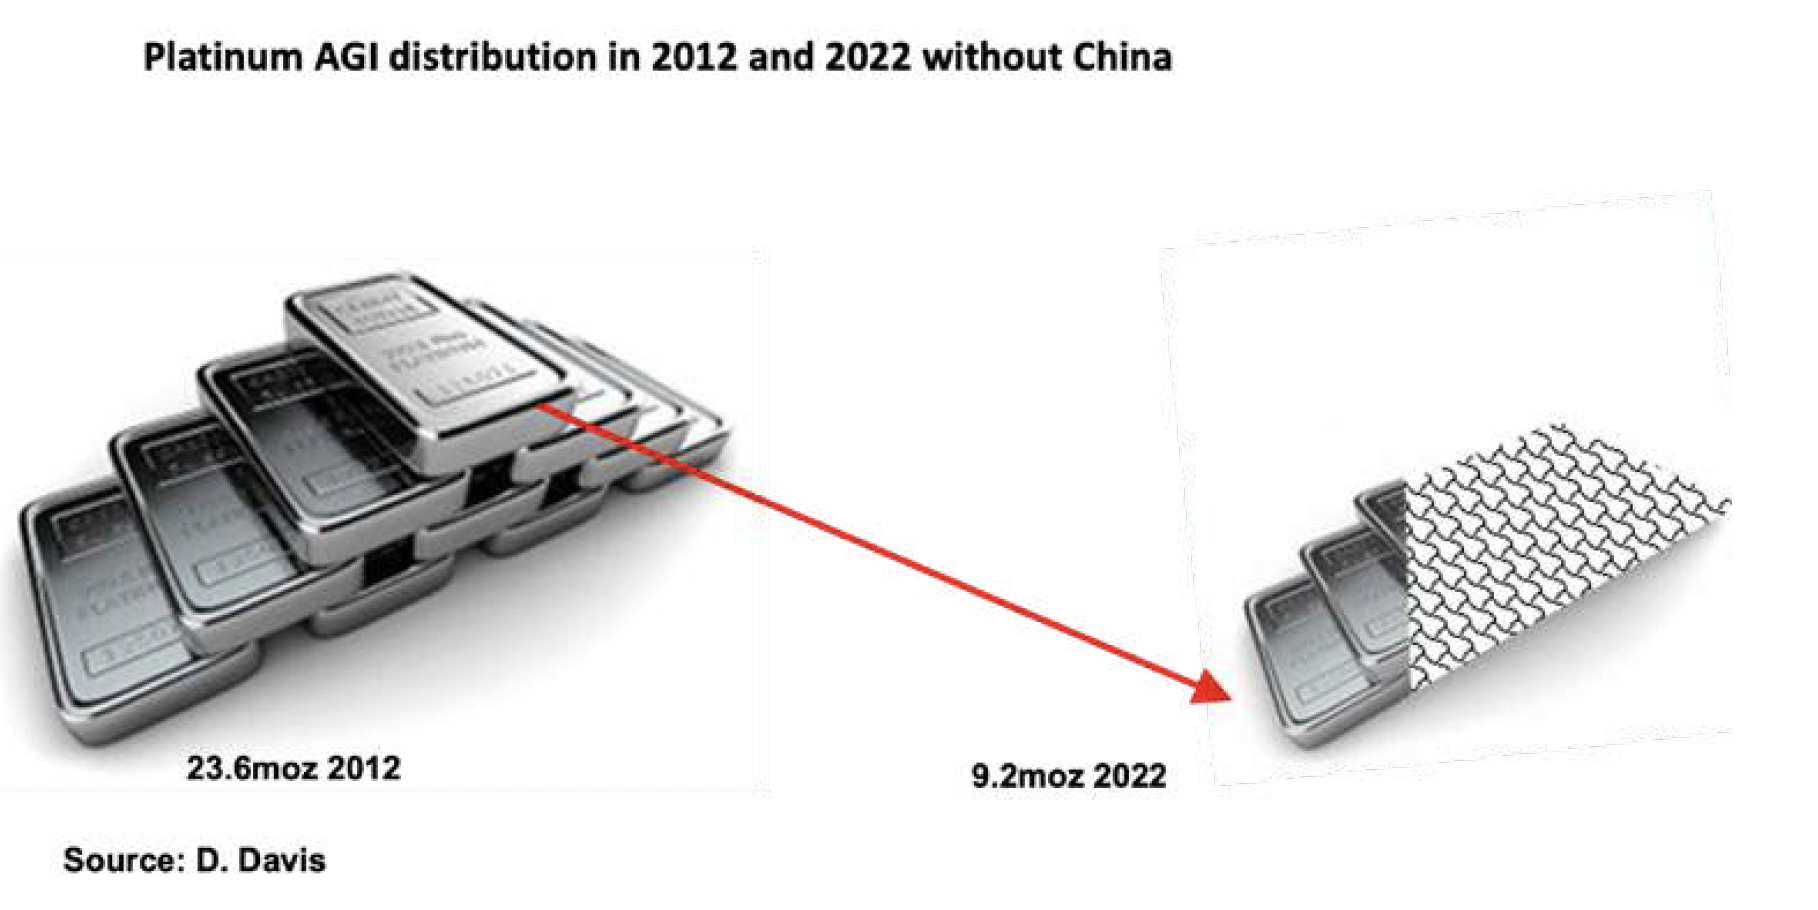
So, what’s left? A drawdown of the platinum AGIs of the remaining regions of around ~9.1moz. In this regard, the strategic importance of estimating AGI by region becomes apparent.
The accelerated rate at which China has imported platinum in excess of demand since 2009 will likely have a catastrophic impact on global platinum supply-demand. Where will the additional platinum come from to satisfy global decarbonisation?
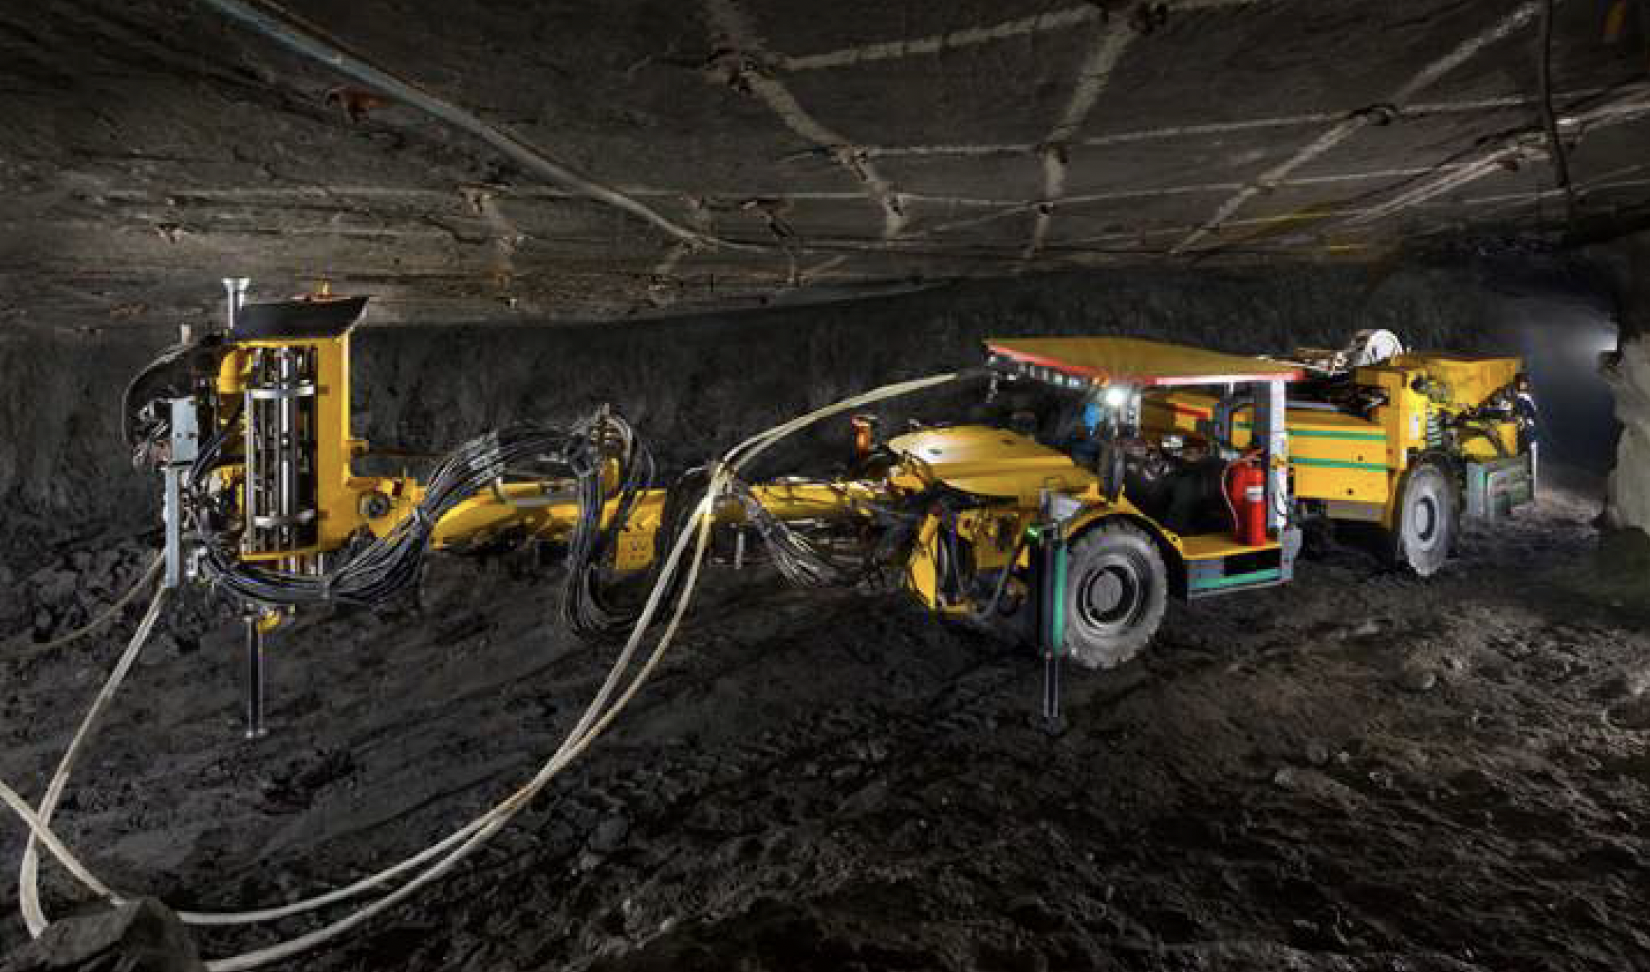
For example, the needs of the other platinum demand sectors, including additional platinum used in FCEV and PEM water electrolysers. It is doubtful that additional primary PGM supply will come from the South African platinum mining industry unless the rate of return on investment is significant; furthermore, a new mine would take at least 10 years to commission ceteris paribus. The South African platinum mining industry is already in medium-term decline.
It is only a matter of time before the impact of this growing global supply demand deficit bites and we see a very substantial rise in the price of Platinum.
Tracking the Above Ground Inventory (AGI) of Platinum Globally and by Region
Above Ground Inventory (AGI) Estimates:
This review tracks the AGI of platinum globally and by region in the form of holdings in unwrought bars or powder form, together with semimanufactured forms: bars, rods, wire, sheets and strips of a thickness, excluding any backing, exceeding 0.15mm, flake, pellets, mesh, foil and tubing, among others. Inventory estimates exclude metal contained in autocatalysts, exchange-traded funds (ETFs) and commodity exchange declared stock holdings: Nymex, Tocom and Shanghai Gold Exchange (SGE). These forms of platinum will be analyzed in a subsequent report.
Much has been written about platinum stocks where research organisations have referred to AGI as an ‘unknown quantity’ or an ‘estimated quantity‘ that ‘cannot be calculated’. This is a sad state of affairs as it presumes these organisations do not know how to calculate the quantum of stocks, nor do they know their geological locations (except for China).
The excuses described above are quickly brushed over by the research organisations; for example, the ‘exact extent of AGI at any given time is unknown’, but ‘they support the functioning of the PGM markets’, or ’are a proxy for changes in stocks‘ held by fabricators, dealers, banks, and depositories, or ’nobody knows the exact extent of market stocks, but they do, this is well known‘.
In a recently released white paper on platinum, JM indicated that the “platinum available for future applications is more than the annual supply-and-demand profile indicates. There are substantial platinum AGI’s in the world as well as below ground resources especially in South Africa. Furthermore, in four of the last six years, more platinum has been placed on the market than has been required by its various users. Such an imbalance is often seen for PGMs, where a simplistic law of supply and demand does not apply.” This declaration by JM, in my view, should have caused alarm bells to ring with regards to the adequacy of the simple supply-and-demand law. Again, no quantum or regional distribution is presented in the white paper.
I see that Metals Focus is also of the view that there are abundant above-ground stocks of platinum, but their data, in my opinion, does not accurately account for the entire picture surrounding imports, exports, and the geographical location of platinum AGIs.
JM in a recent virtual conference indicated what the evolution and structure of the platinum supply-demand equilibrium could possibly look like in the future. “Stocks, recycling of above-ground metal, and increased mining can all play a role. An increase in PGM supply from South Africa together with an increase in secondary supply to achieve market balance could be dependent on AGI being absorbed for shortterm imbalances.”
The key questions surrounding this model are: what is the expected quantum of platinum AGIs and where are they located? (Excluding below-ground resources). This strategic model appears to be reliant on ‘hope more than substance‘, as we know that worldwide platinum mine supply is in decline.
With China likely to continue to suck up available platinum mine production, the impact on the price of platinum will certainly be positive.
Even more concerning is the estimated variance of platinum AGI reported by these research organisations.
The World Platinum Investment Council’s (WPIC’s) definition of AGI is: “The year-end estimate of the cumulative platinum holdings not associated with exchange-traded funds; metal held by exchanges or working inventories of mining producers, refiners, fabricators, or endusers. Typically, unpublished vaulted metal holdings from which a supply-demand shortfall can be readily supplied or to which a supplydemand surplus can readily flow.”
The WPIC has recently adjusted its definition of AGI specifically to isolate and concentrate on the section of the definition that alludes to “the unpublished vaulted platinum holdings from which a supply-demand deficit can be readily supplied, or to which a supply-demand surplus can readily flow”.
In a recent report, 60 Seconds in Platinum (21 June 2023), the WPIC presumed that at the end of 2022 the global platinum AGI amounted to almost ~5moz. Furthermore, the additional and significant platinum imports into China over demand, and the estimated impact on AGI amounted to some ~80% of total AGI. The WPIC deduced from these ‘estimates’ that the Rest of the World will have only six weeks worth of platinum to meet global demand by the end of 2023.
The WPIC recently updated this forecast for 2023 and is now indicating a platinum market deficit of ~1,005koz on the back of stronger demand and weaker supply. Under these circumstances, the market will tighten and put upward pressure on the price of platinum.
The key problem surrounding the WPIC‘s deductions is that all the inputs are based on ‘estimates’. Furthermore, it is misleading in so far as it simplifies the supply-and-demand equation. The overall result of an increasing platinum deficit is, however, correct.
Again, these statements and descriptions go a long way in supporting my assertions about the importance of assessing import and export data when forecasting market balance trends.
I contend that the results of this exercise go a long way towards completing the bigger picture of the platinum industry by providing a crucial link. The ‘missing links’ surrounding the platinum market balance are the quantum of platinum imports and exports, and the global and regional platinum AGI, which have not been independently quantified.
Given these scenarios, I am of the view that it is imperative for the industry to significantly advance its current timeline and replace the obsolete and simple supply-demand equation with a real market balance equation.
Will the PGM industry advance and take a ‘giant leap’ away from misleading estimates to the all-important real-world data and the realworld market equation of:
MARKET BALANCE = (IMPORTS – DEMAND) – EXPORTS
Admittedly, it requires a vast amount of data to collect and audit. But I am of the view that the PGM industry simply cannot afford not to use real-world data.
The impact of supply-demand and AGI estimates:
The impact of using the simple supply-demand market balance and AGI estimates in the PGM and investment industries is mind-boggling as fundamental strategic investment decisions hang, in part, on this simple supply-demand equation. For example, will there be enough platinum to satisfy decarbonisation demand?
The WPIC estimates that the broad-based commercial adoption of fuel cell electric vehicles (FCEVs) could add more than 3moz to yearly platinum demand in 10 years’ time. Furthermore, hydrogen-related platinum-based proton exchange membrane (PEM) and FCEVs are expected to grow substantially in the medium term, becoming a meaningful component of global platinum demand by 2030.
An amount of US$300bn has been potentially allocated for this investment. There are many other examples of significant investments: the IAE has indicated that annual clean energy investments in emerging and developing economies will need to more than triple from US$770bn in 2022 to as much as US$2.8trn by the early 2030s to meet rising clean energy needs.
The real-world platinum regional distribution of AGI:
My recent series of analysis began with a graphic illustrating the global and regional platinum AGI trends between 2007 and 2022.
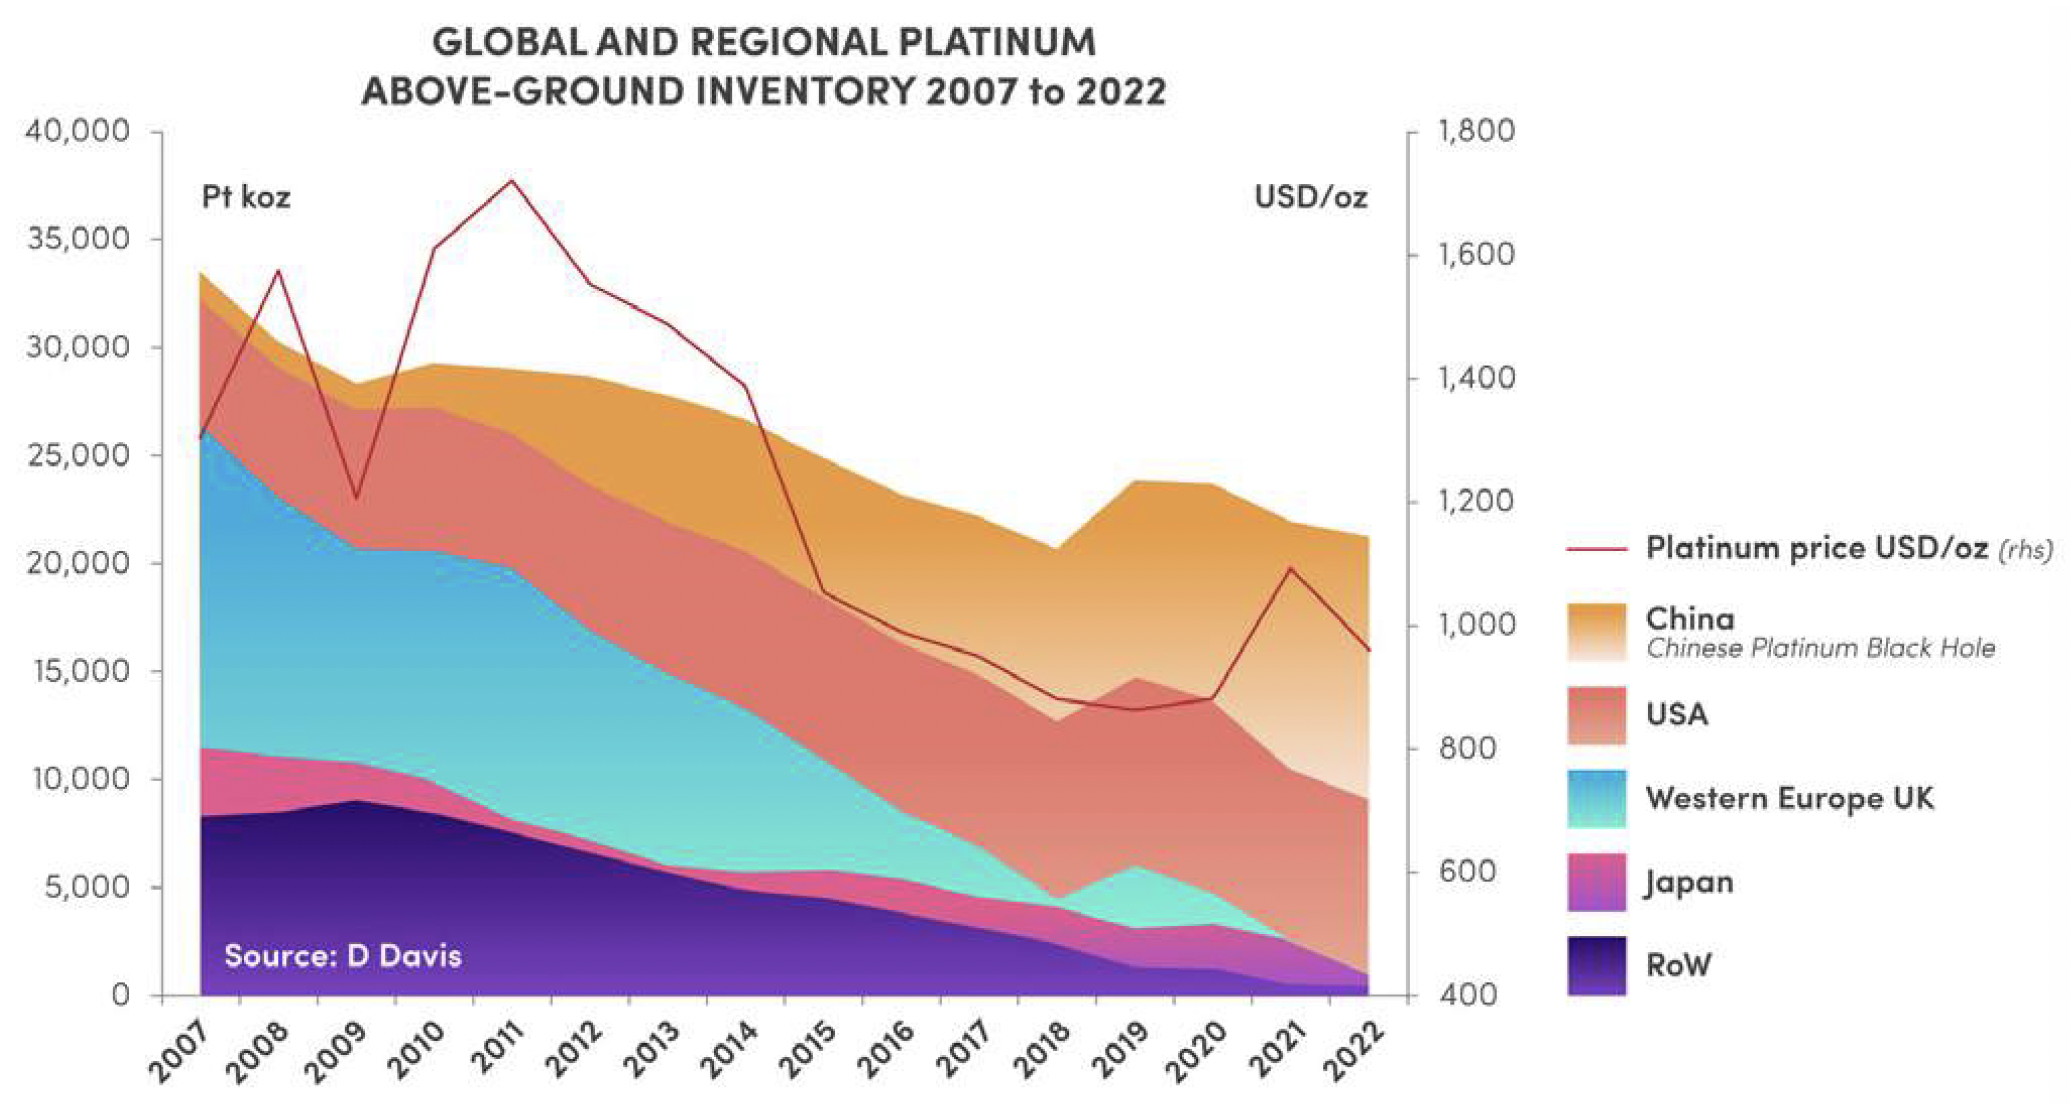
Using the real-world equation trends in AGI reveals vital information concerning the regional distribution and the quantum of platinum contained in AGIs.
I am of the clear opinion that the PGM and investment industry as well as research organisations and other interested parties, do not have an accurate understanding of the structural changes in the platinum AGI between 2007 and 2022.
- China AGI has absorbed ~12moz, which represents ~57% of the apparent global platinum AGI of ~21.2moz. This is a catastrophic quantum of platinum that will be lost to the Western world, which will undoubtedly impact the rate of global decarbonisation and in turn put significant upward pressure on the price of platinum.
- The USA has built its AGI to ~8.1moz.
- Western Europe / UK AGIs are on their last legs, possibly bolstered by manufacturing stocks.
- Japan’s AGI has declined to ~1.8moz.
- The Rest of the Worlds’ AGI is also on its last legs.
So, what’s left? A drawdown of the platinum AGIs from the remaining regions of around ~9.1moz. In this regard, the strategic importance of estimating AGI by region becomes extremely apparent.
Regional platinum AGI trends:
In this conversation, I focus on the quantum of platinum AGIs by region together with the quantum of platinum imports and exports. This data is illustrated graphically, which best shows the structural changes in AGI between 1993 and 2022. I have kept comments on ‘events’ that impacted platinum over this period to a minimum. The impact on price is obvious.
The USA
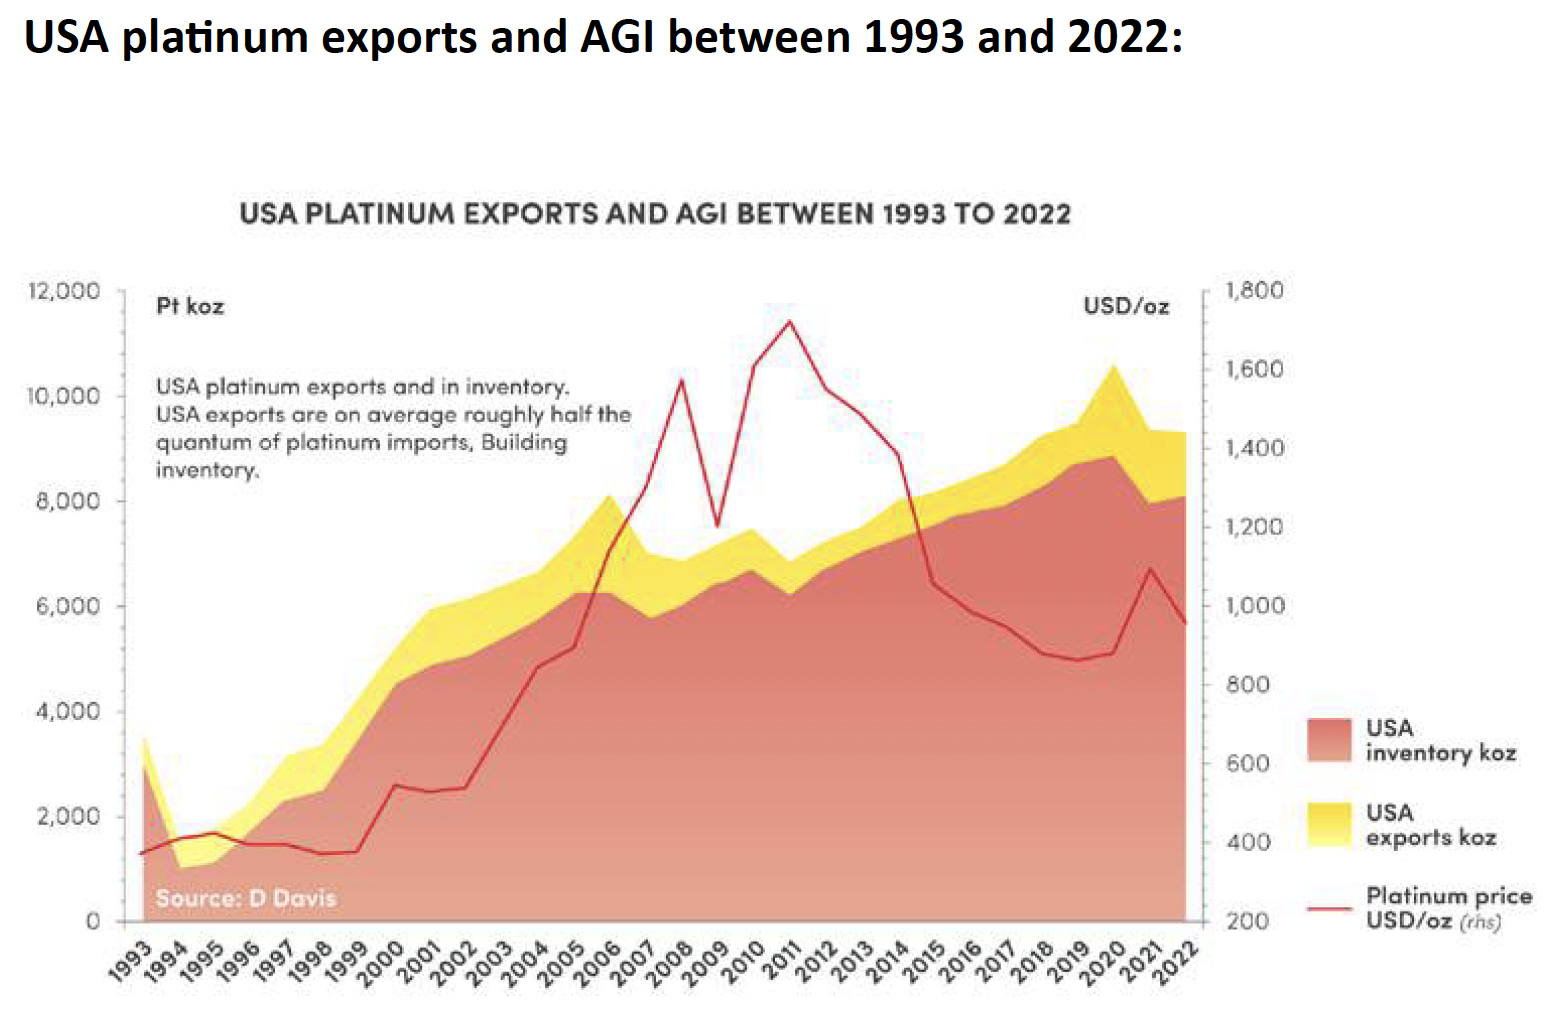
USA platinum AGI between 1993 and 2022:
The USA has continued to build its platinum AGI at various rates over the period, as shown below. These changes go hand in hand to some extent with the rate of imports into the USA, as would be expected.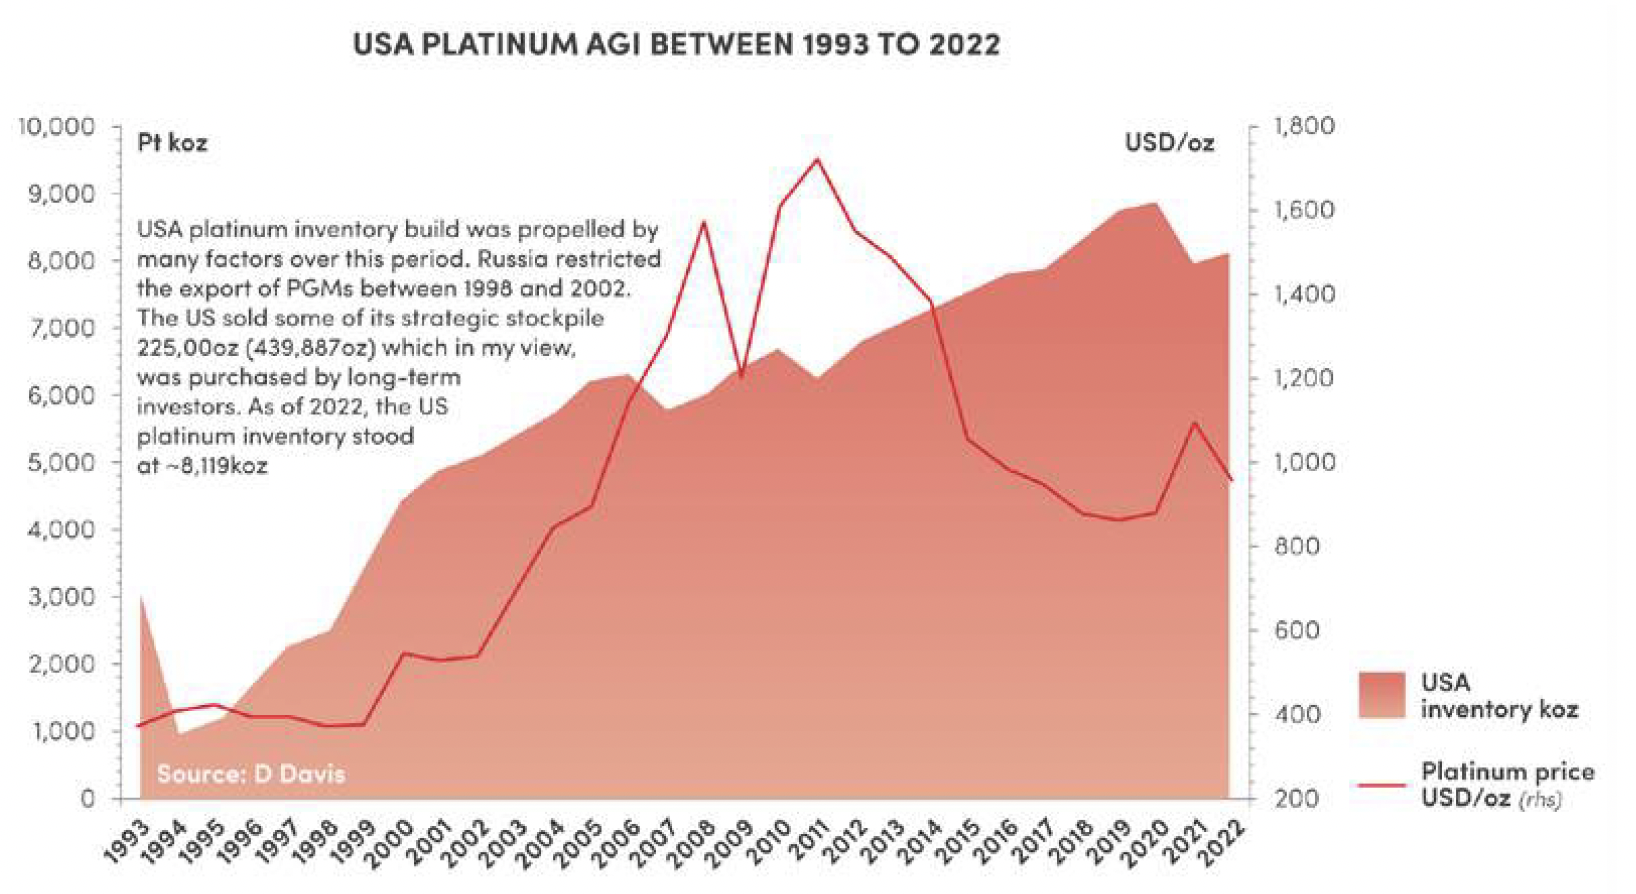
2004 - 2006: The Securities and Exchange Commission (SEC) loosened the net capital rule.
2007 - 2010: Financial crisis, the great recession and high platinum prices resulted in drawing from AGI.
2020: Covid resulted in drawing platinum down from AGI.
It is interesting to note that disruptions at the supply level did not significantly affect the USA’s AGI, for example, the prolonged labour strike on the South African platinum mines in 2015. 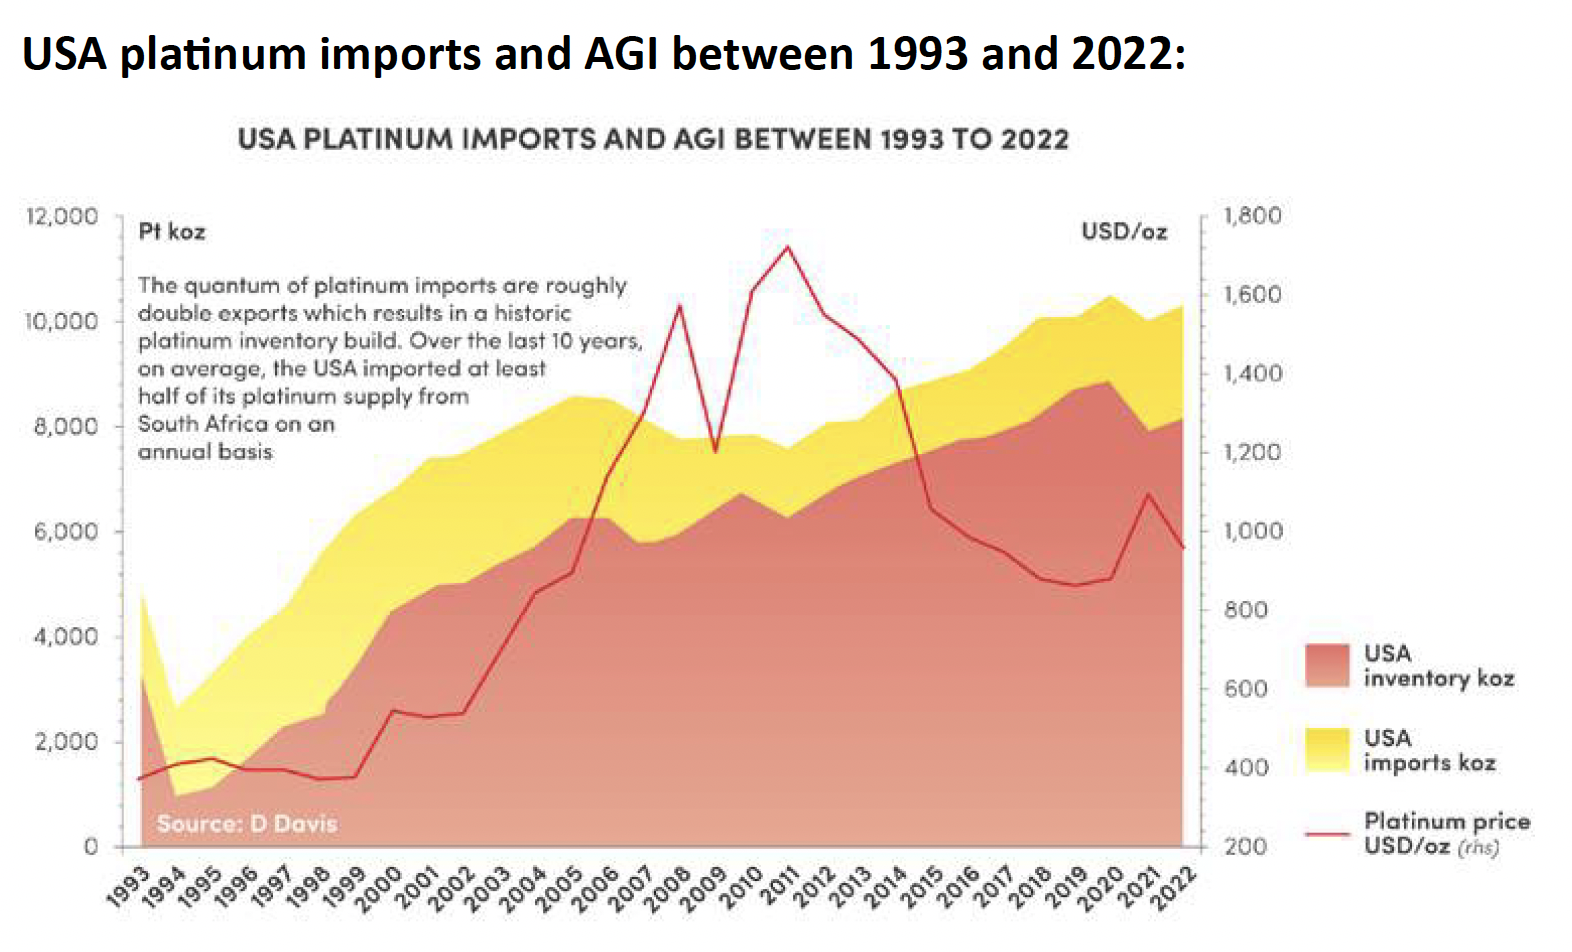
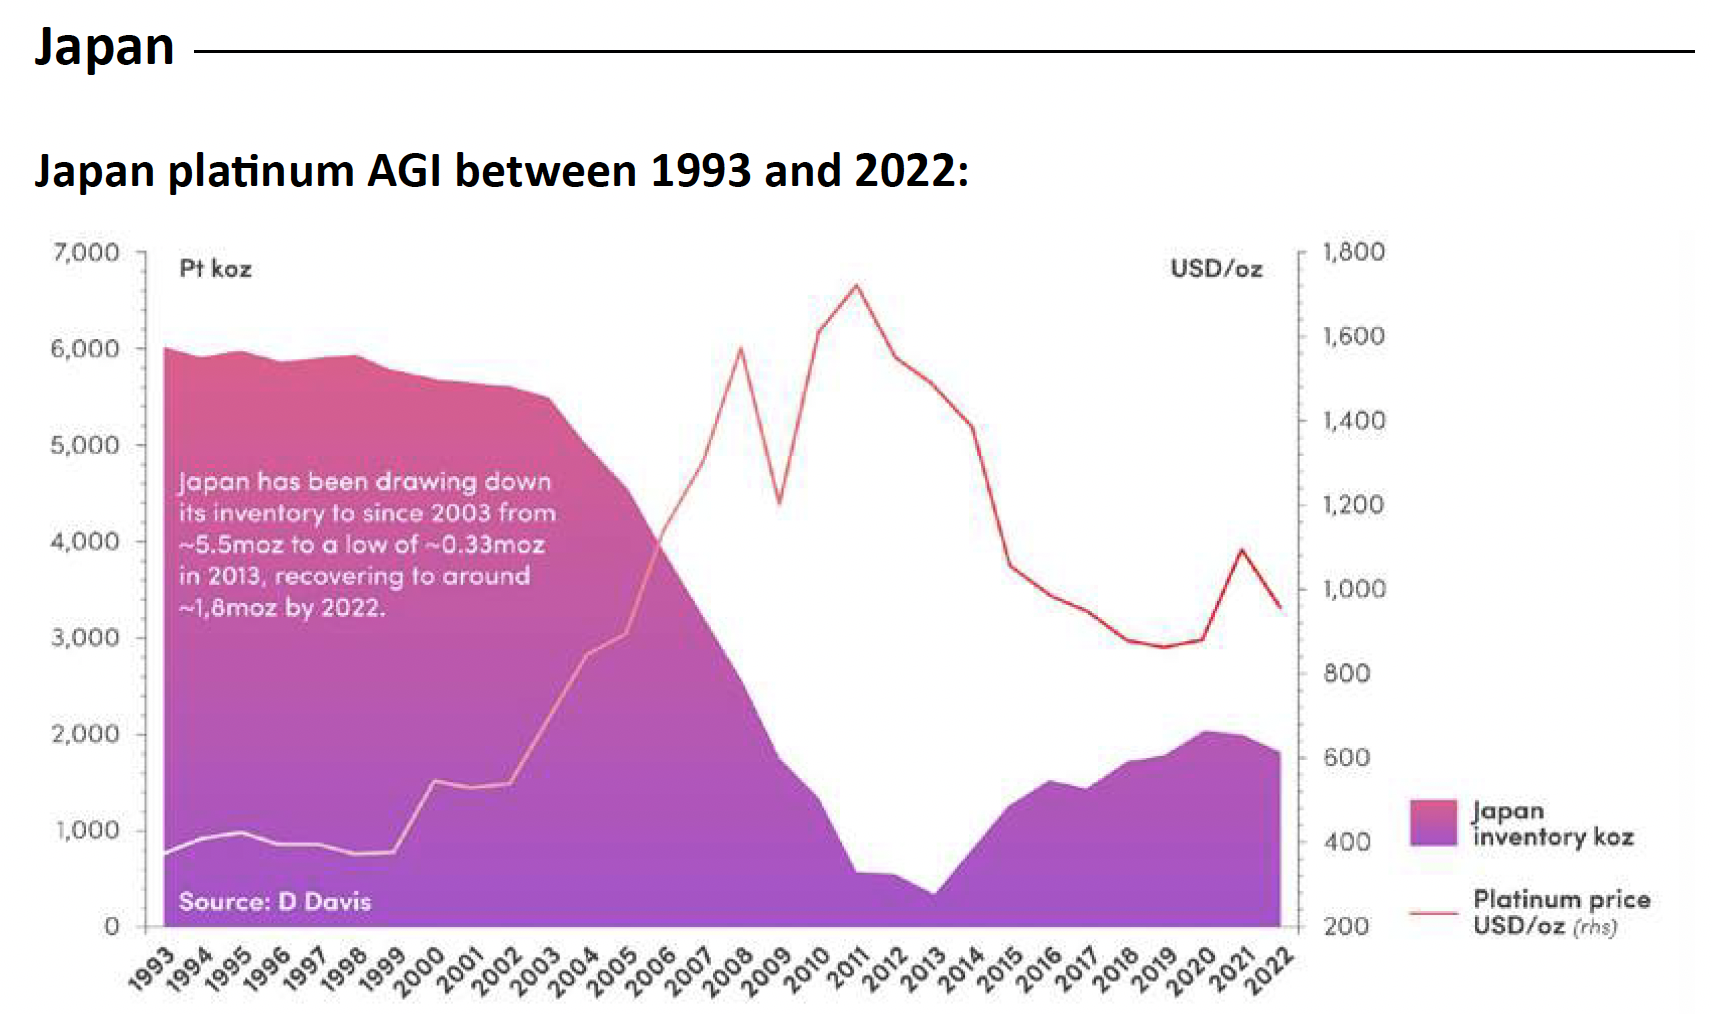
According to the Japan Automobile Dealers Association, sales of new vehicles in Japan dropped to 4.2m in 2022, which was the lowest level since 1977, as the global semiconductor shortage continued. The introduction of electric, plug-in hybrid and fuel cell light vehicles had no effect on the decline in AGI as the penetration rate was only around 2% to 3% in 2022. The decline was likely due to Japan’s lingering financial crisis over the past two decades and the Great East Japan Earthquake in 2011.
Japan platinum imports and AGI between 1993 and 2022: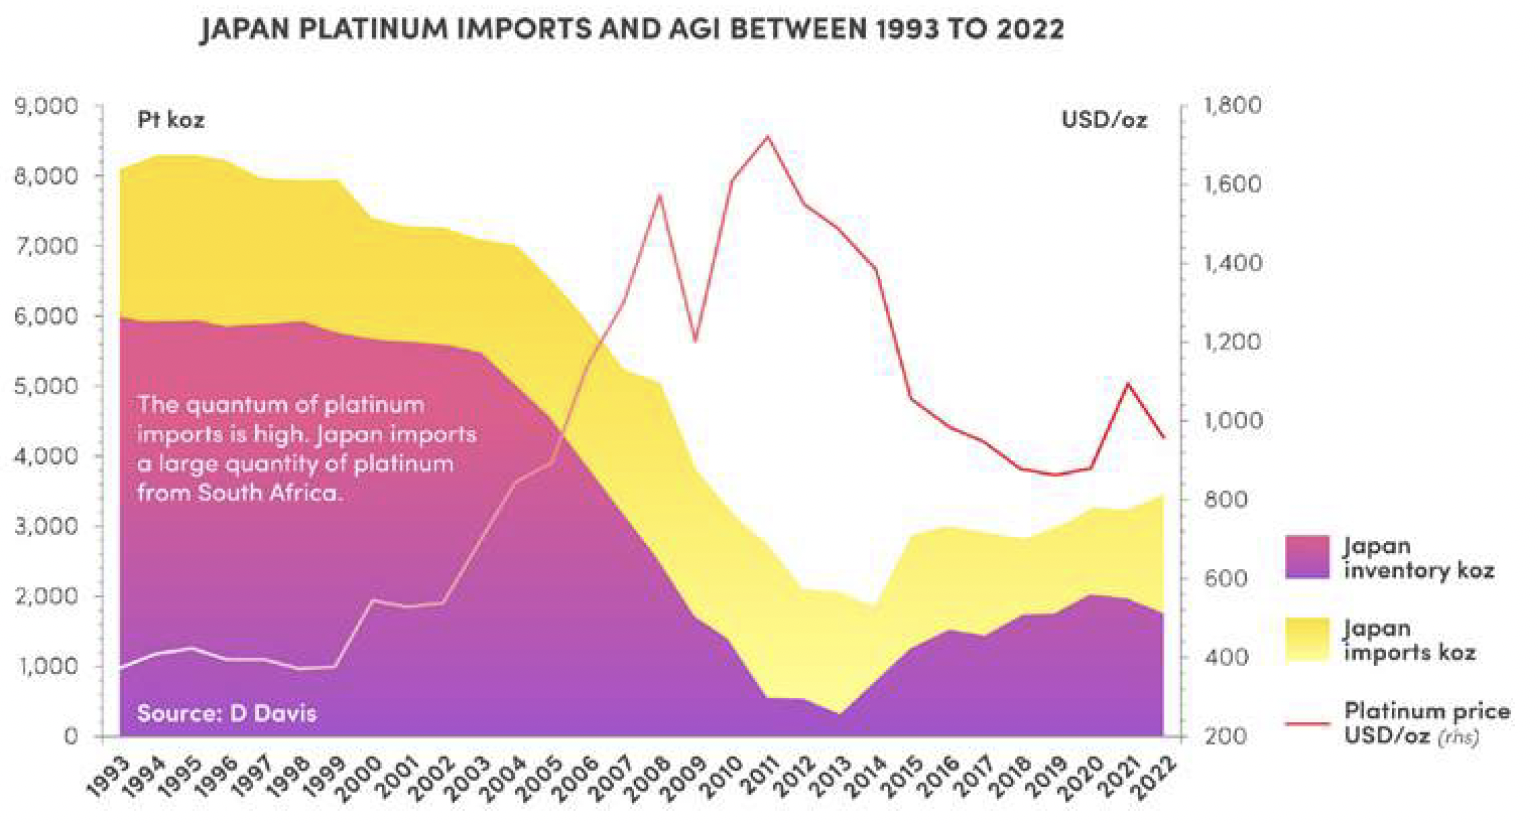
The decline in AGI together with an increase in platinum demand starting around 2003 is partly attributable to Tokyo Government regulations. This lowered particulate matter emission limits for heavyduty diesel vehicles including the retrofitting of catalysts: the fitment of an oxidation catalyst or diesel particulate filter (JM). 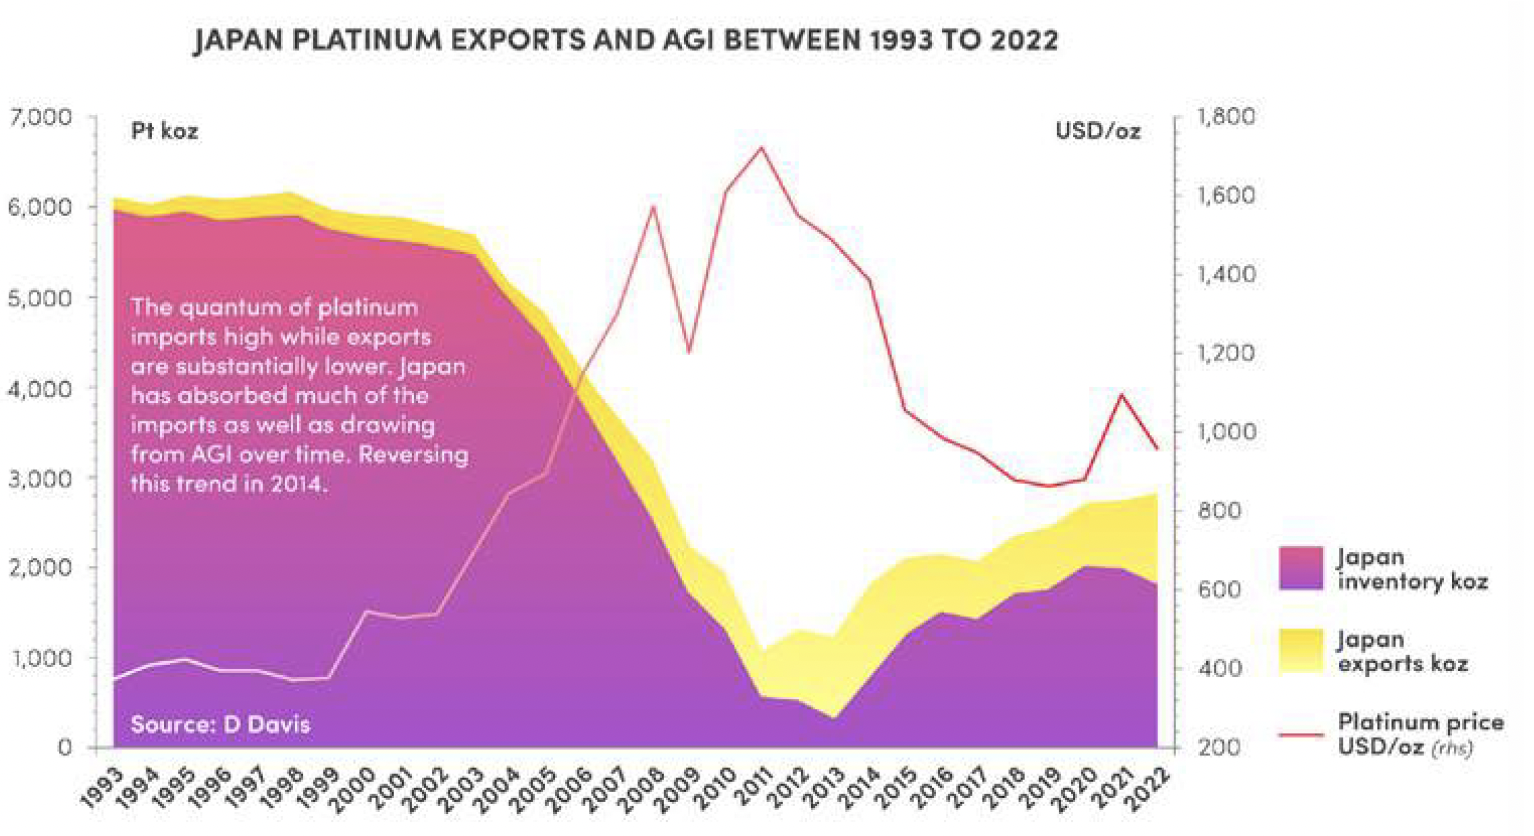
Japan is by far the world’s largest user of platinum in three-way catalysts: strategic considerations have led Japanese car manufacturers to retain platinum in their gasoline catalyst mix (JM).
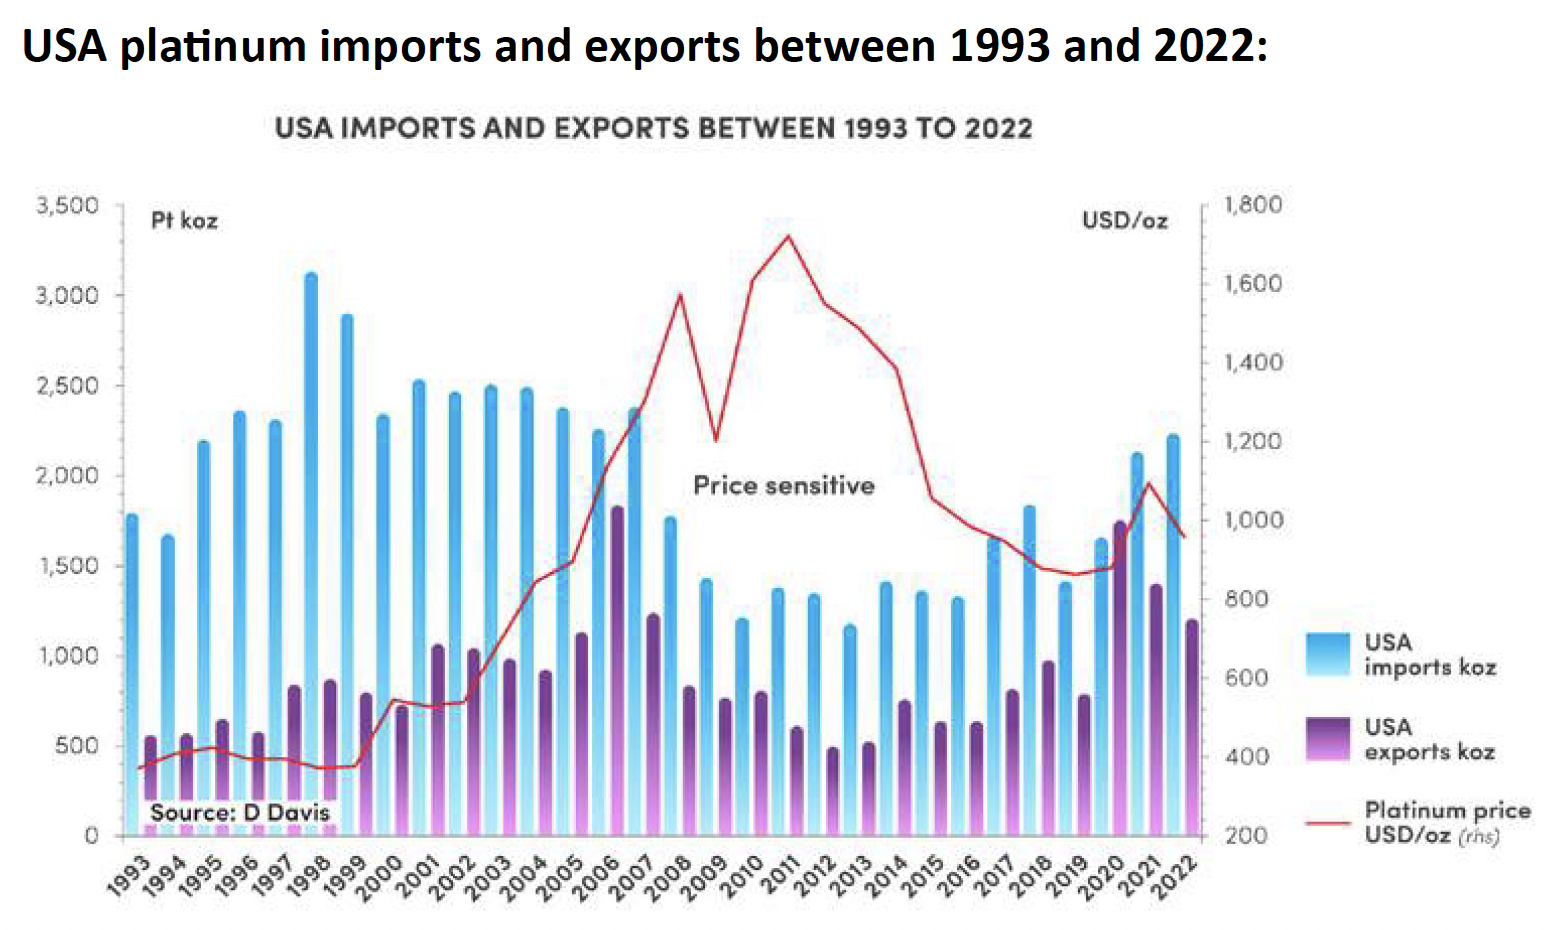
Japan platinum imports and exports between 1993 and 2022: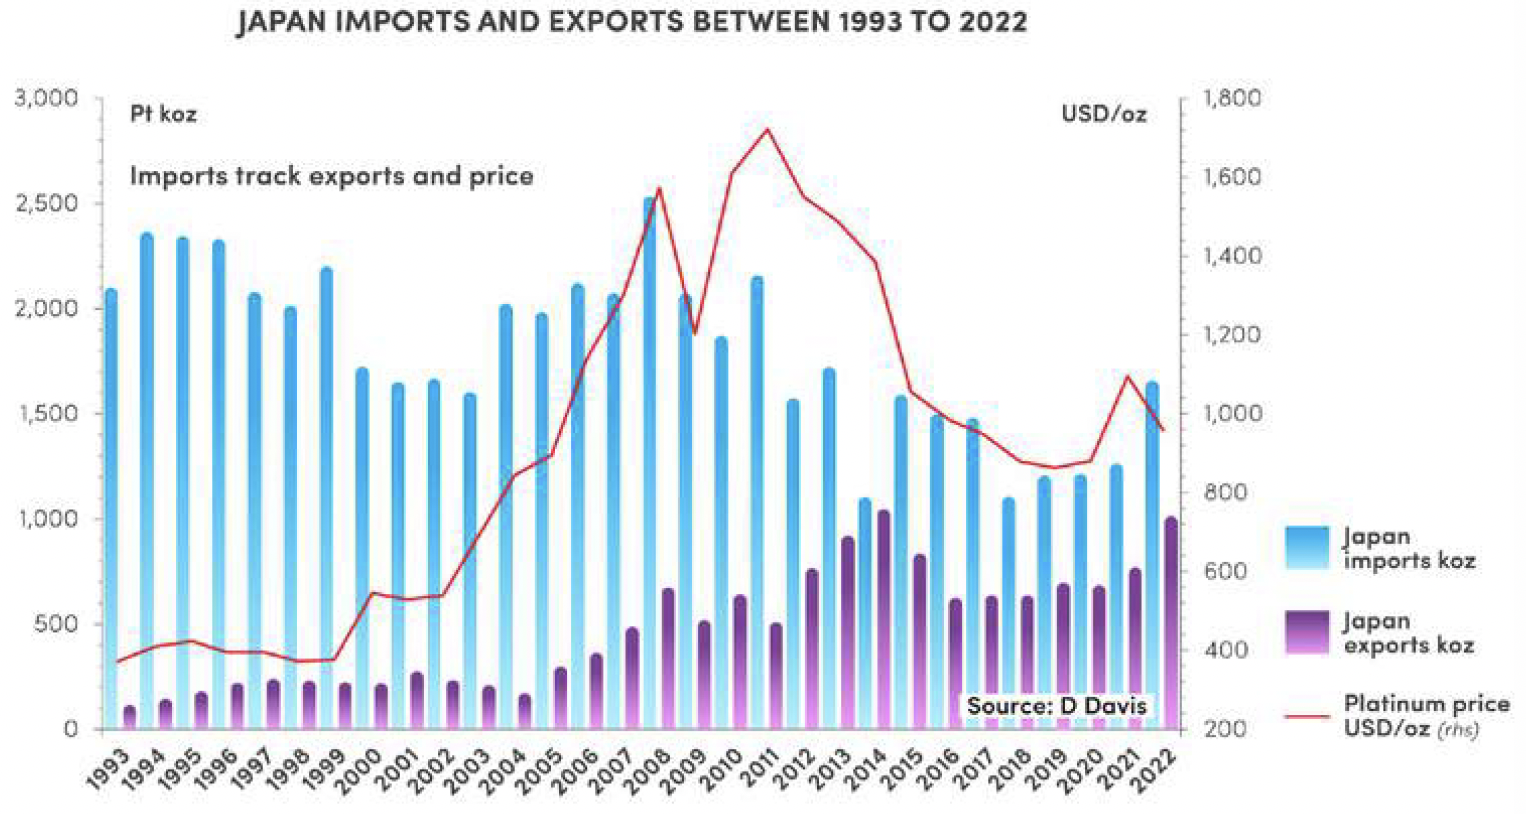
Western Europe / UK
Western Europe / UK platinum AGI between 1993 and 2022: 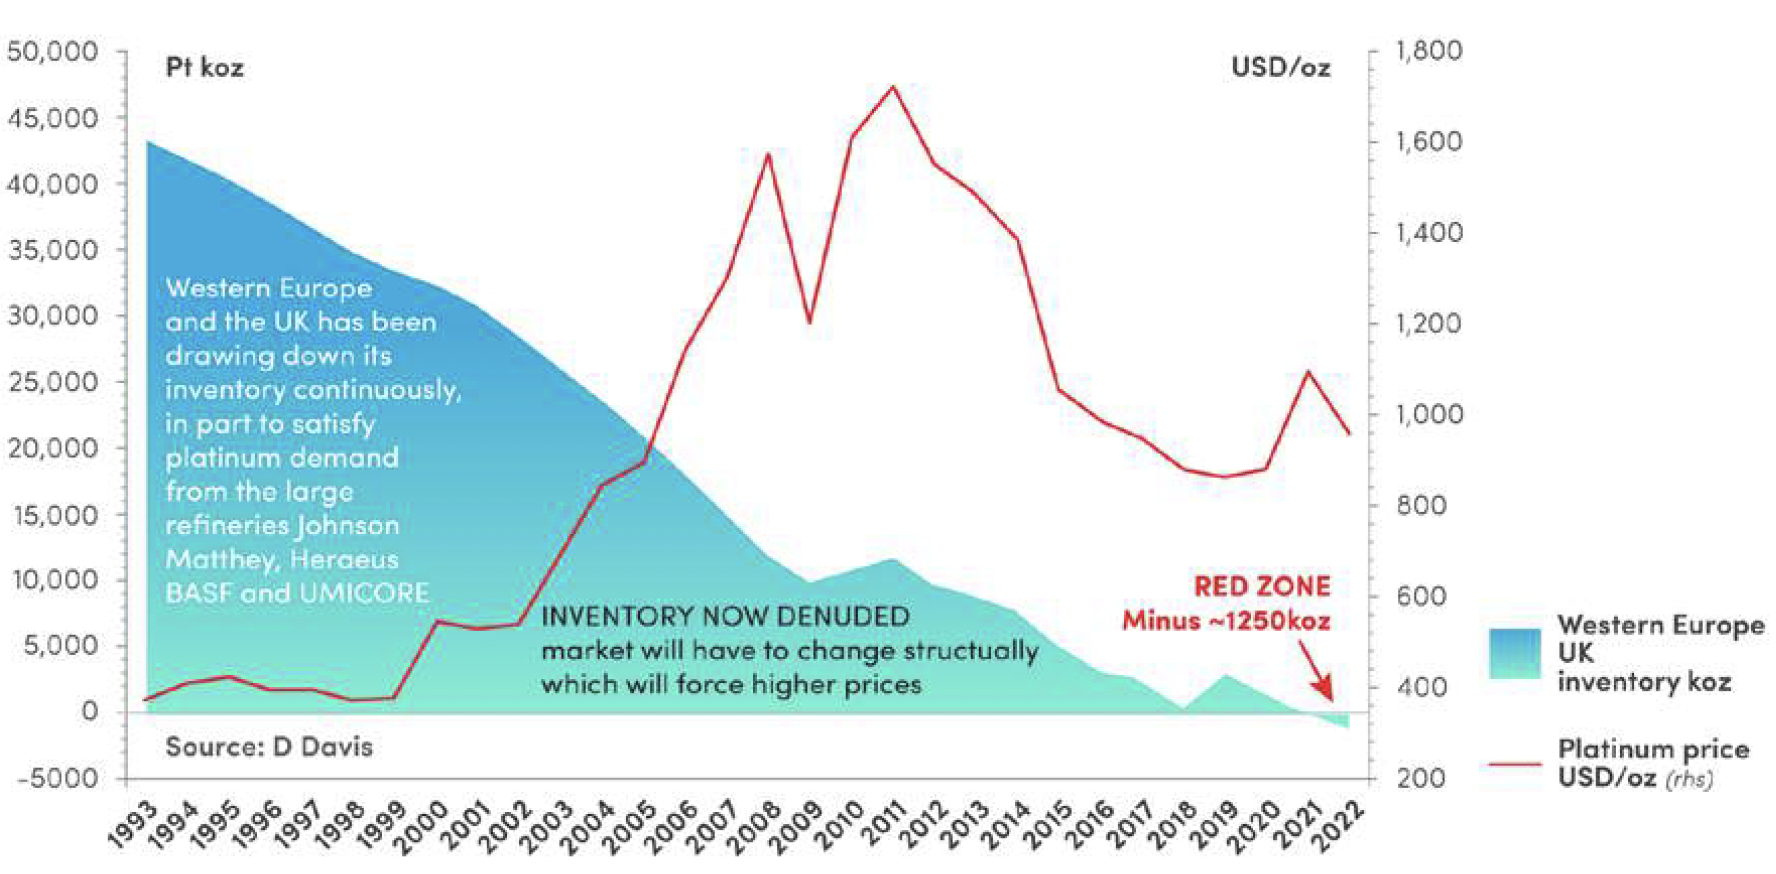
The AGI in Western Europe / UK has been in decline since 1993. I first reported this phenomenon in 2017. It has become obvious that the trends described above cannot go on indefinitely as the AGI will continue to diminish without a top-up by way of additional platinum imports and/or additional secondary refining and/or OEMs’ holdings.
According to a recent Heraeus Appraisal (16 October 2023), “Automotive OEMs are thought to have entered the year with excess PGM inventories, reducing the need for open-market purchases”.
Notwithstanding that Western Europe / UK remain the global hubs of large autocatalyst manufacturers and secondary recycling, among others (Johnson Matthey, Heraeus, BASF and UMICORE).
If China continues purchasing additional imports of platinum at the same rate or at a higher rate, this situation will likely act as an additional catalyst, which will inhibit Europe from seeking supplementary platinum supplies, thereby tightening my forecast of an uptrend in the platinum price sooner rather than later. In addition, I have demonstrated that the USA continues to hold all the cards.
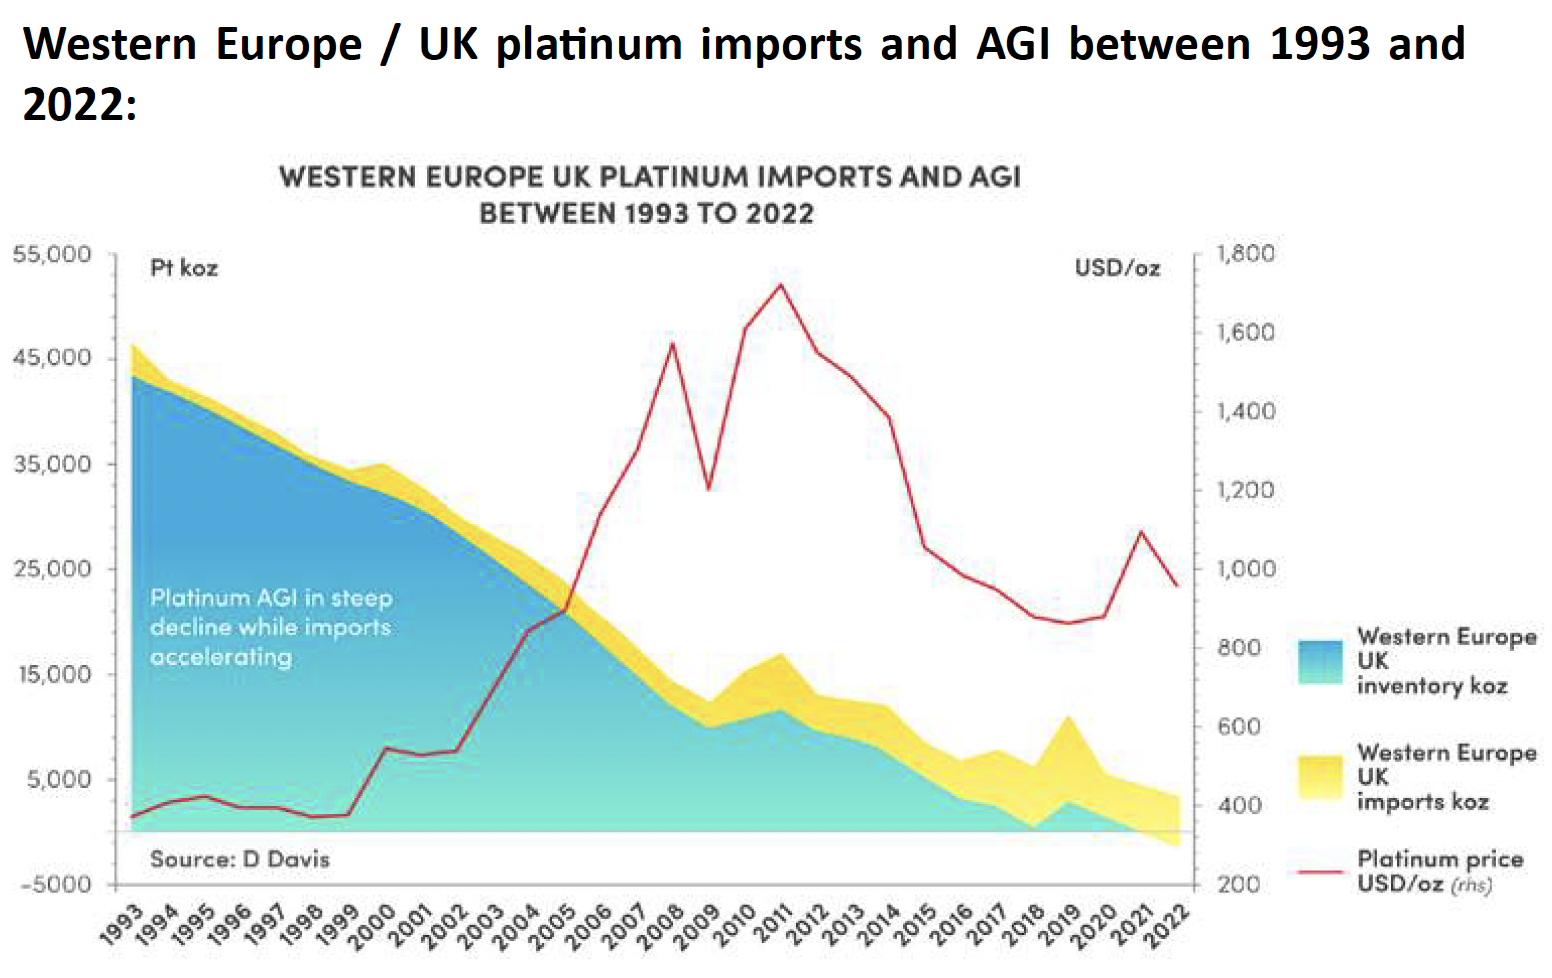
Western Europe / UK platinum imports and AGI between 1993 and 2022:
Western Europe UK platinum exports and AGI between 1993 and 2022: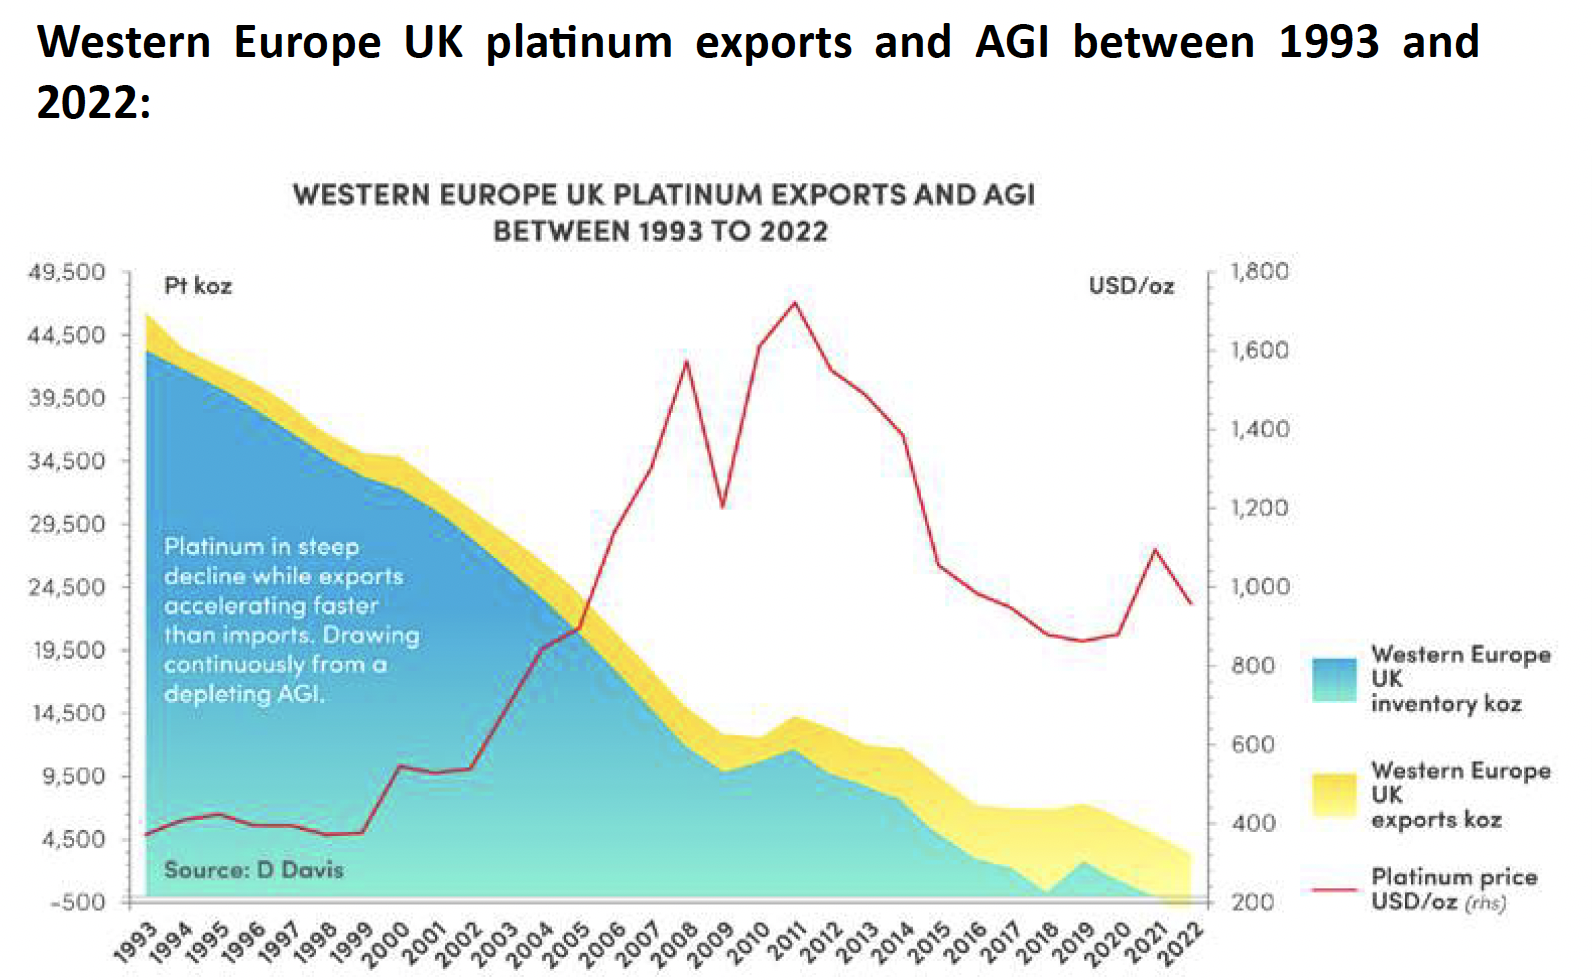
Western Europe UK platinum imports and exports between 1993 and 2022: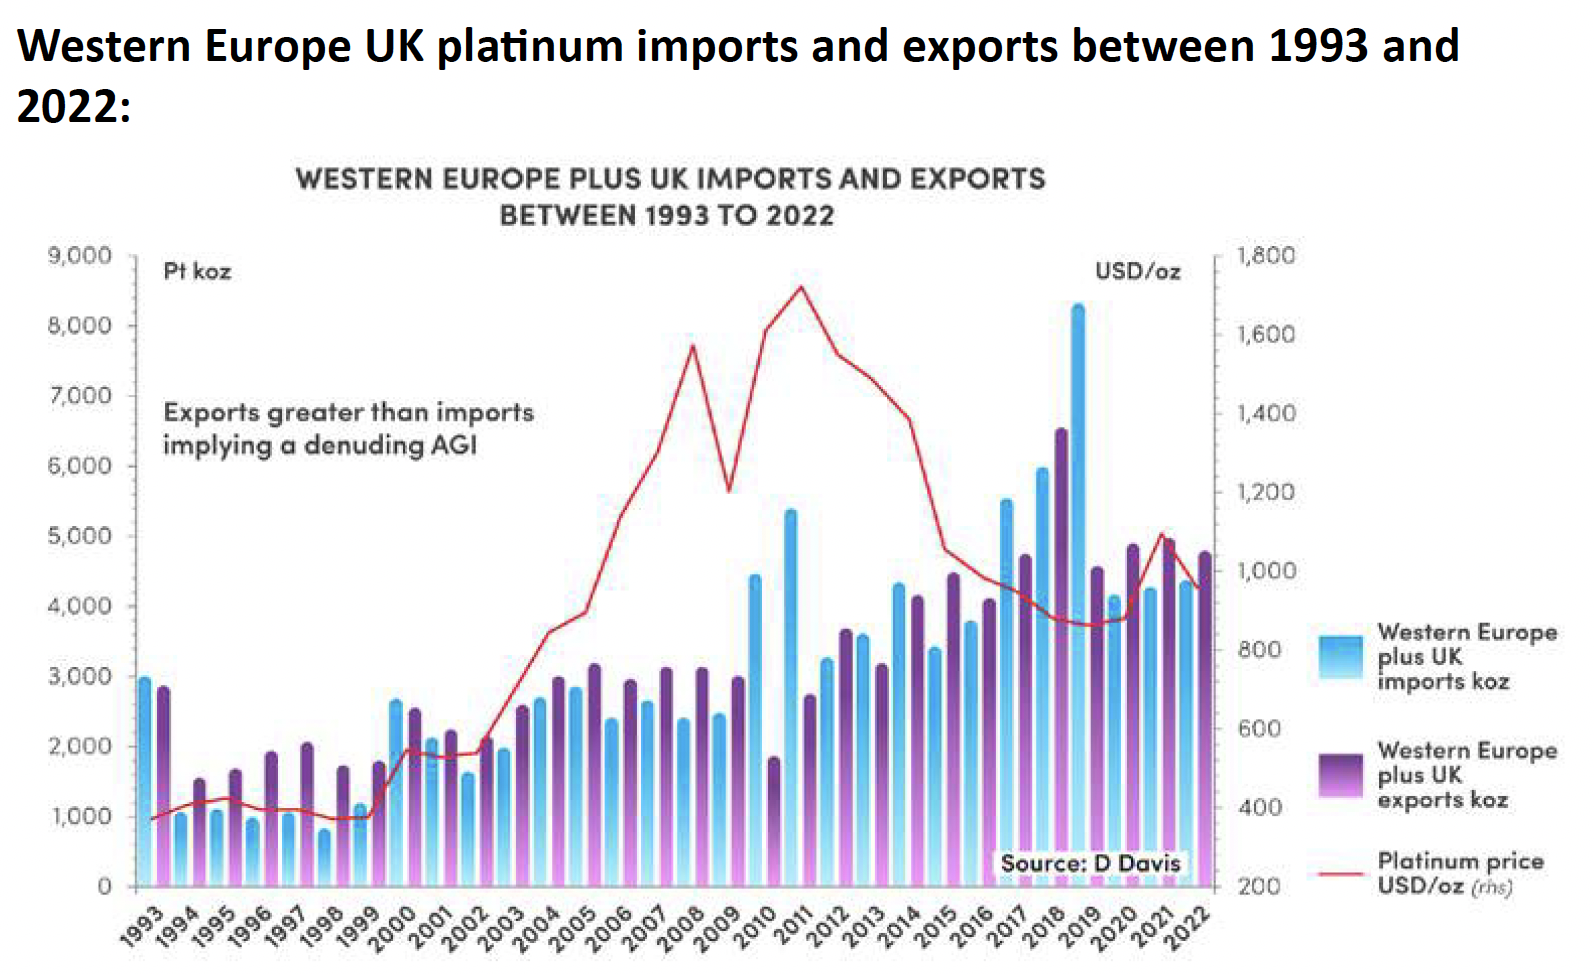
Rest of the World (RoW)
Rest of the World platinum AGI between 1993 and 2022: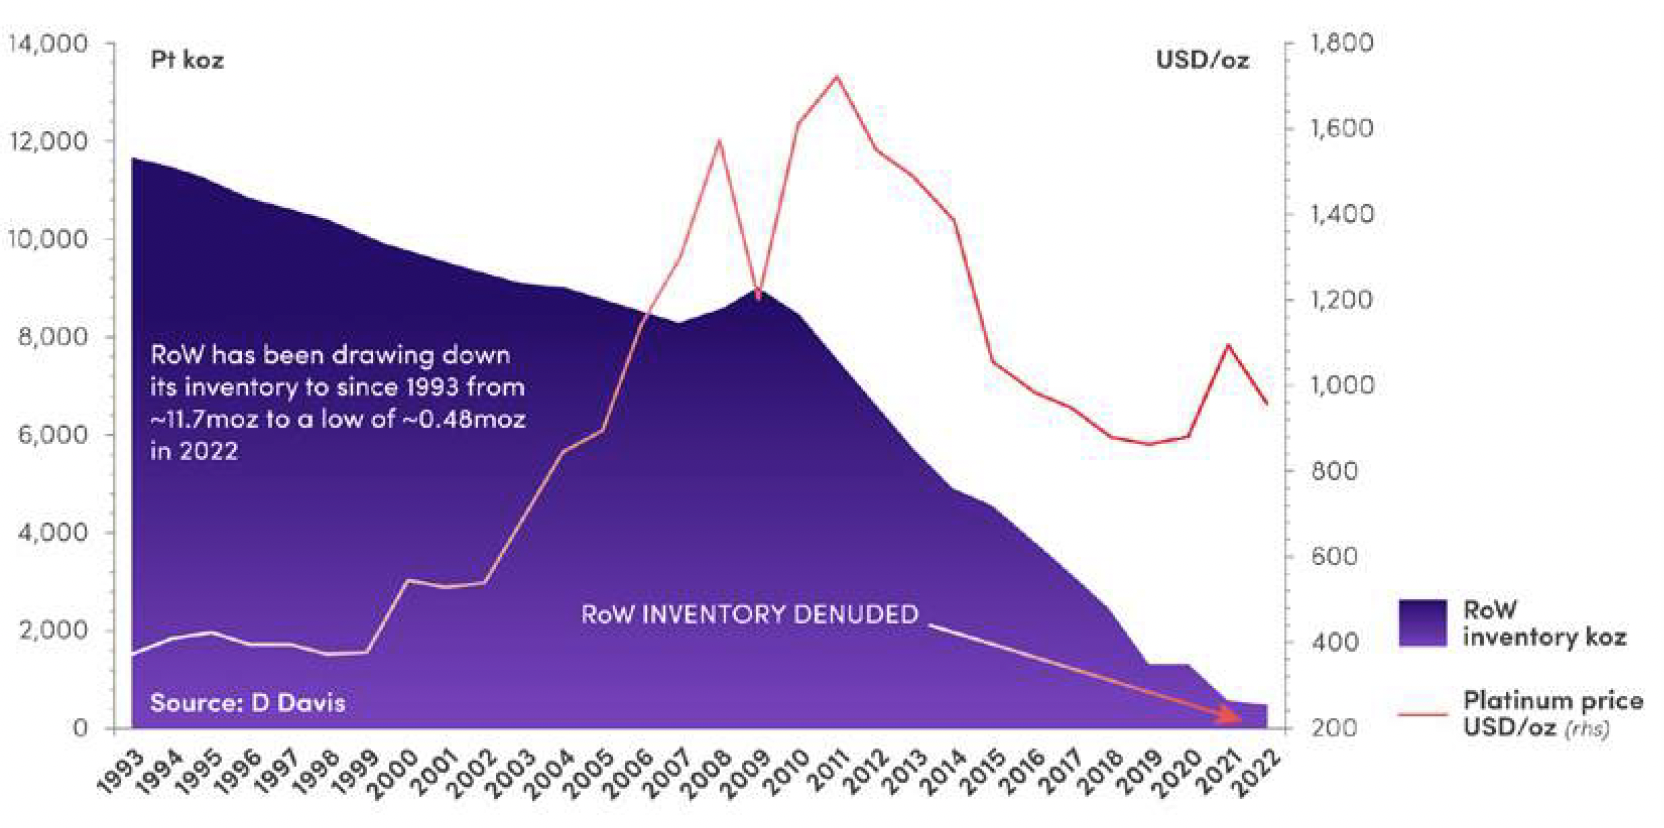
RoW platinum imports and AGI between 1993 and 2022: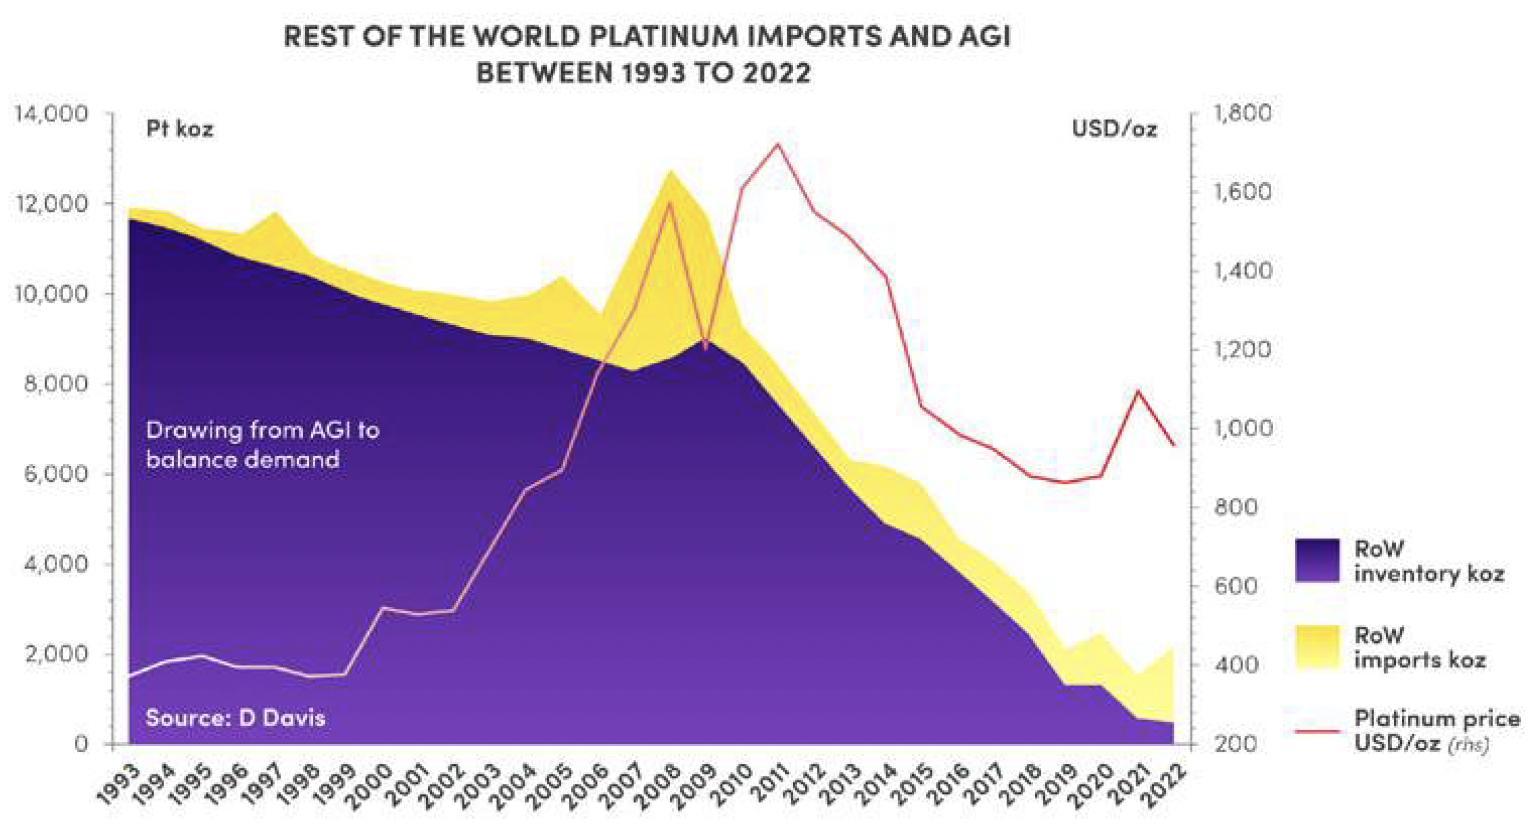
RoW platinum exports and AGI between 1993 and 2022: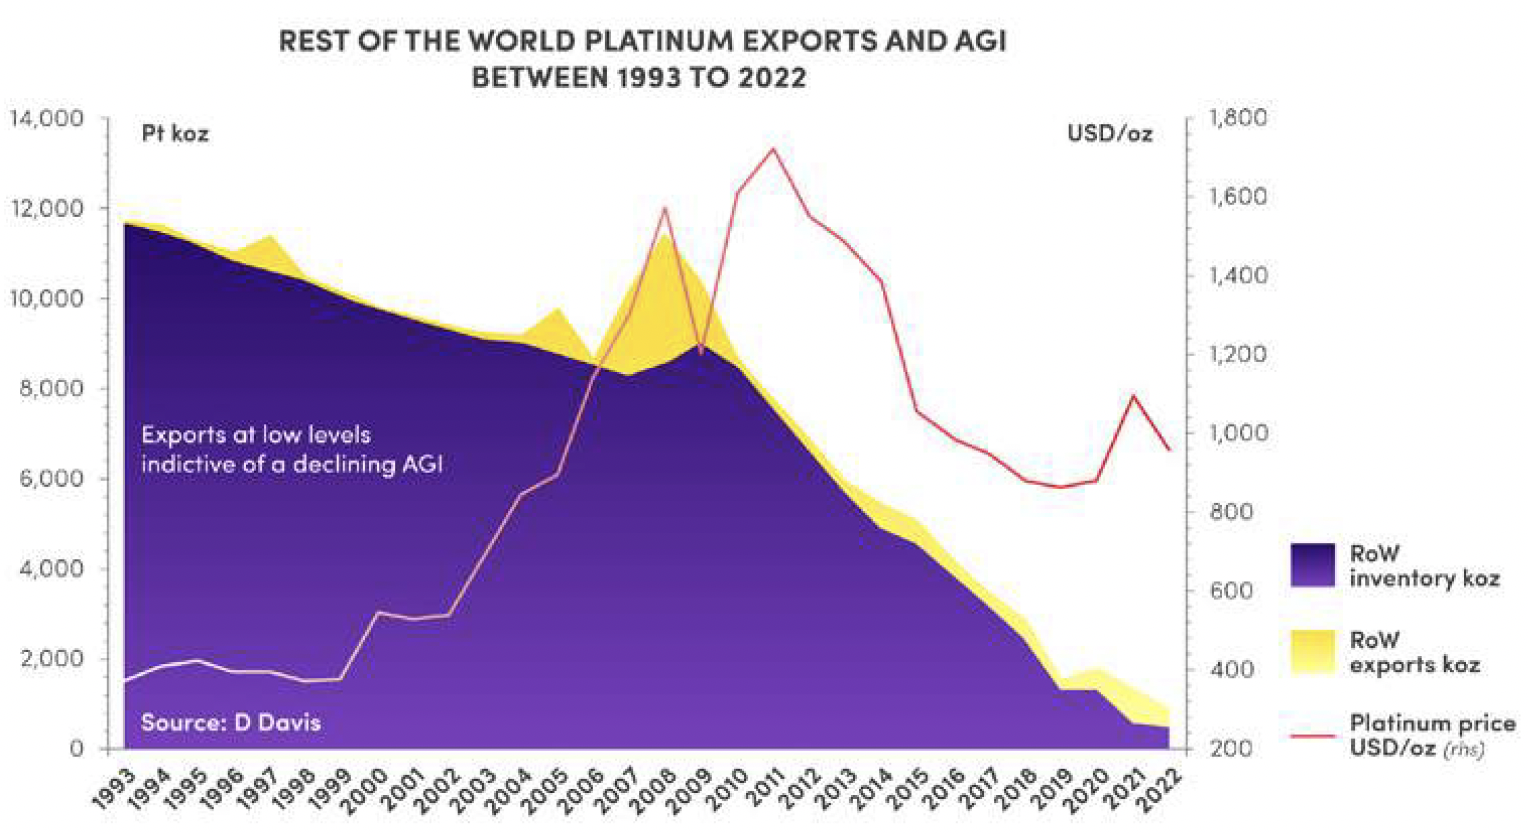
RoW imports and exports between 1993 and 2022: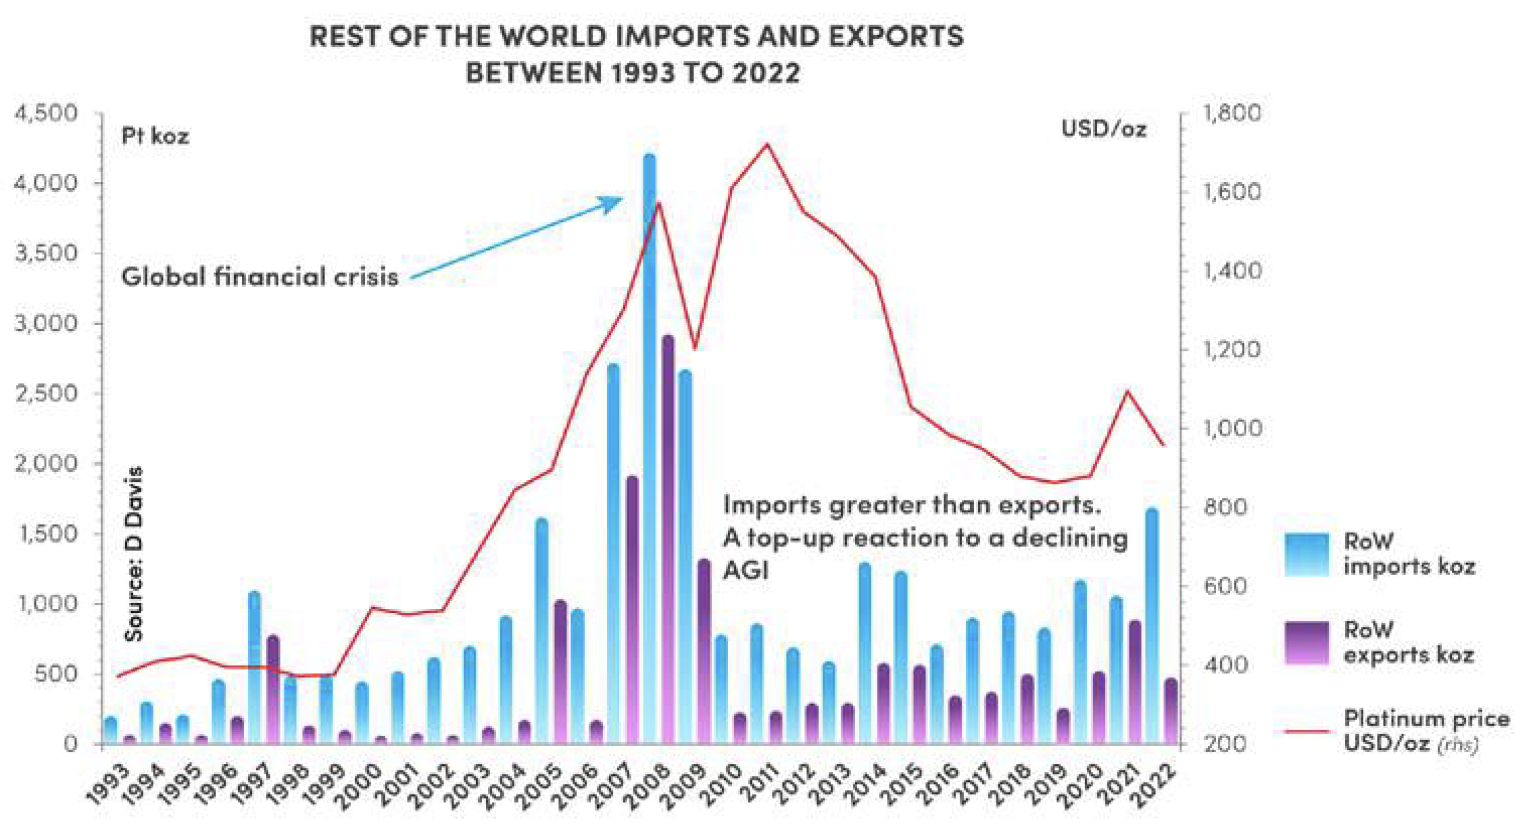
China
China building up platinum AGI between 1993 and 2022: 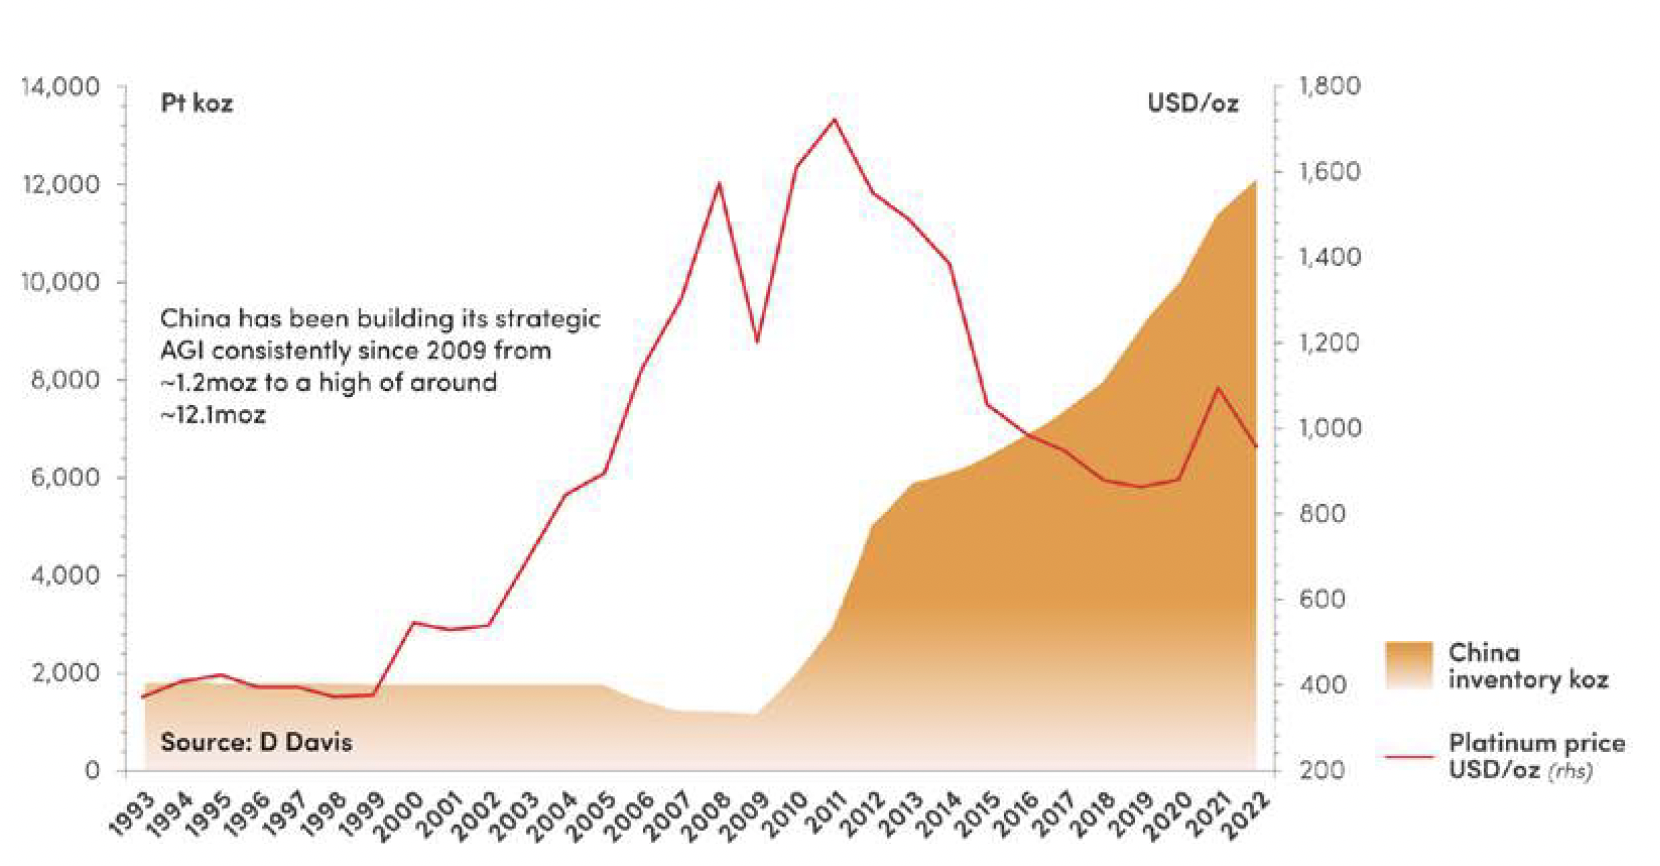
Research organisations have reported widely that China was seen to be importing additional platinum. It is in this regard that I initially focused on China, using it as an example to demonstrate the inadequacy of the simple law of supply and demand.
China platinum imports and AGI between 1993 and 2022: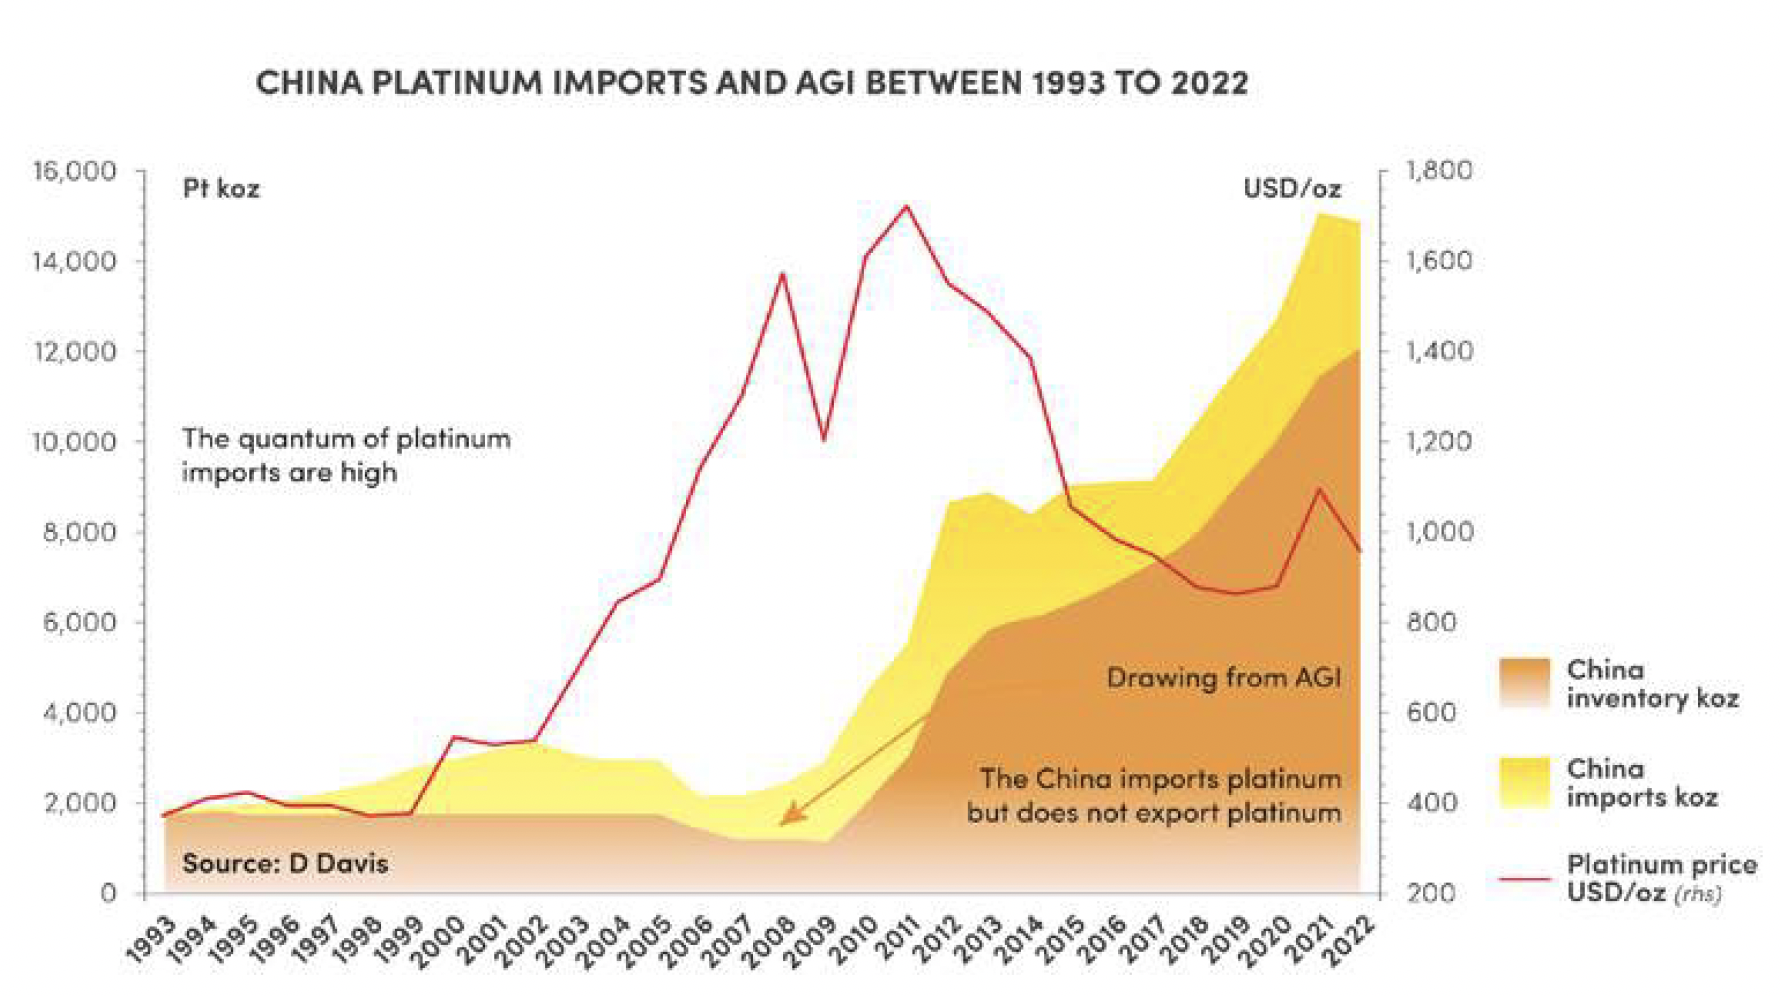
Estimate of additional platinum imports into China in excess of identifiable demand: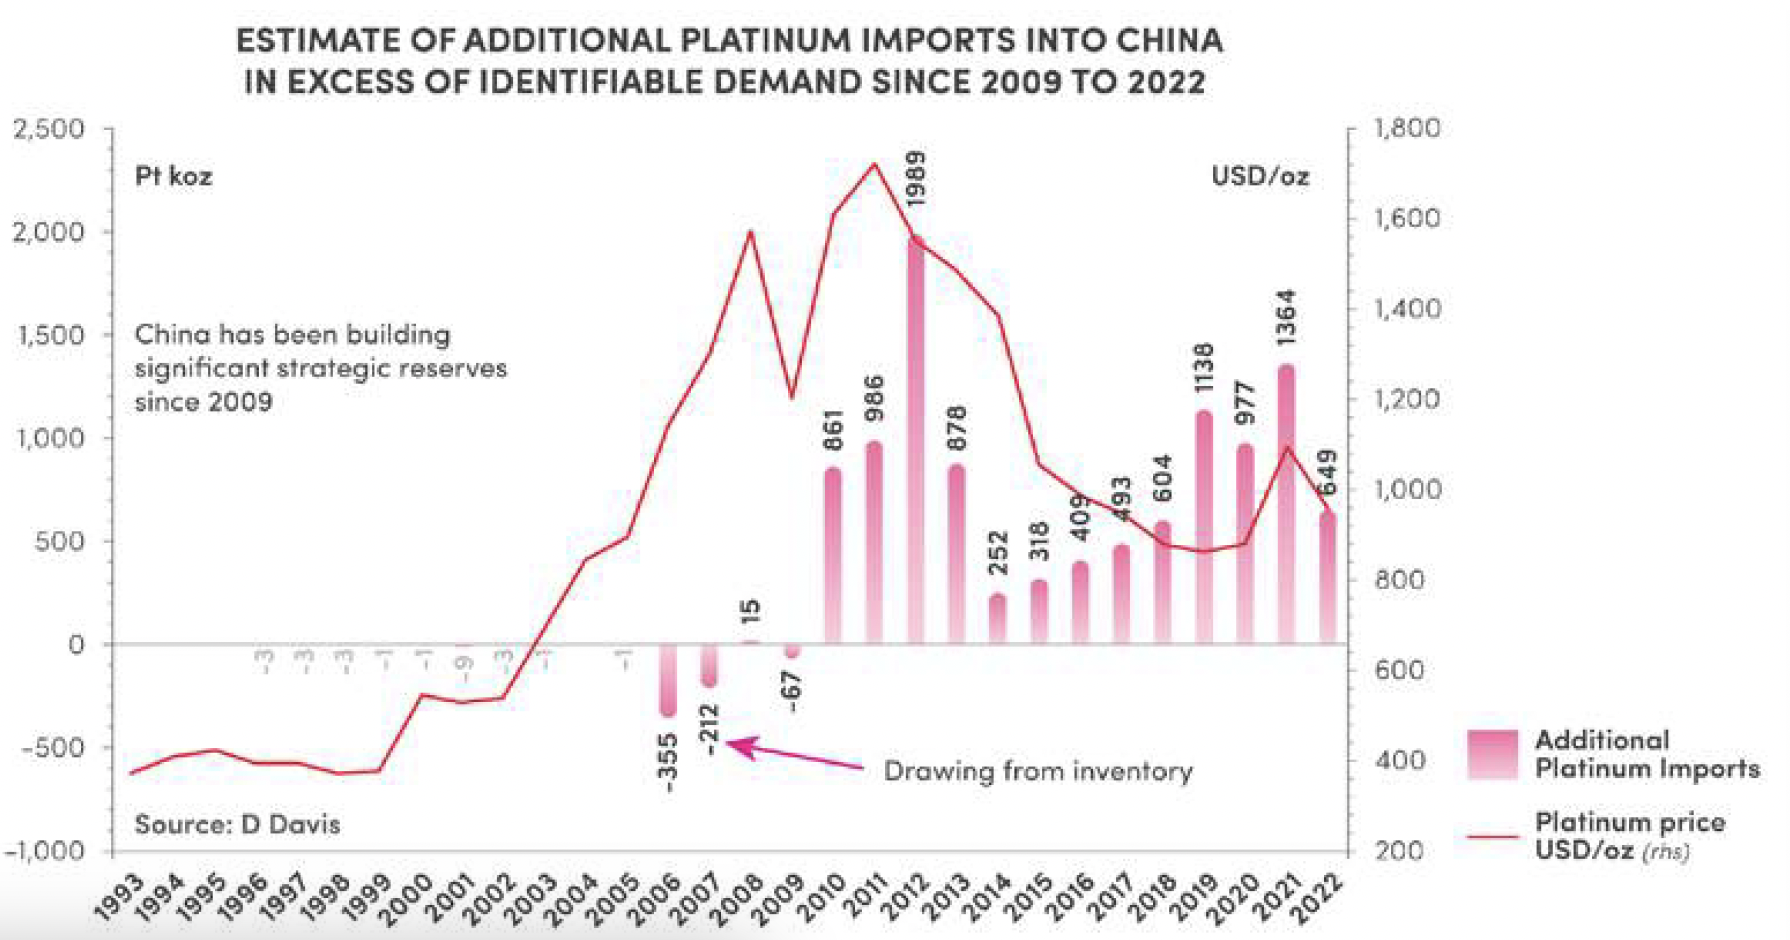
The quantum of platinum imports into China (and via Hong Kong into China) have exceeded demand since 2009.
The quantum of additional platinum imports into China strongly suggests that it is a political decision to build up a strategic metal stockpile.
Global platinum AGI illustrating the quantum of China’s AGI black hole: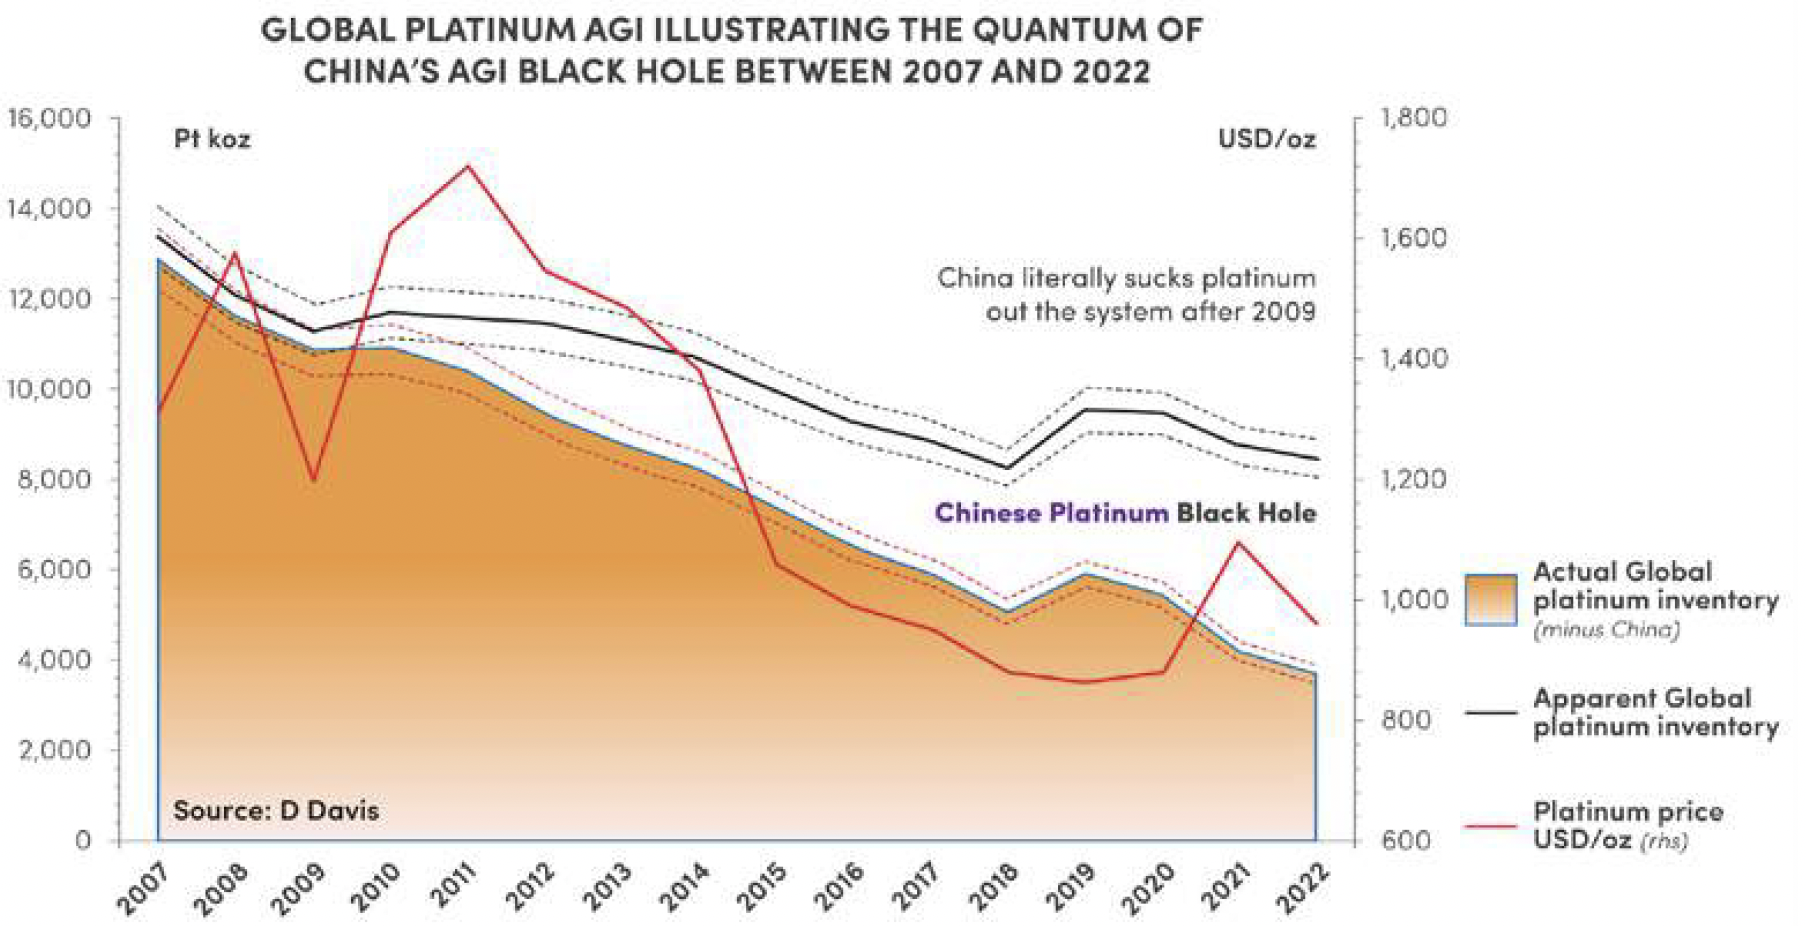
The Chinese platinum ‘black hole’ build up, as indicated previously, potentially represents a catastrophic event for decarbonisation. Increasing primary platinum supply is a long-term solution. The ongoing introduction of all types of battery electric vehicles will to some extent mitigate this looming problem as well as increases in the rate of platinum recycling.
In summary, by using the real-world market balance and regional AGI equation, I have demonstrated the structural changes and the quantum of platinum in AGIs between regions from 1993 to 2022.
The quantum of platinum AGIs between regions has changed significantly from ~28.6moz to ~21.2moz between 2012 and 2022 (including China). This change is illustrated below:
Regional platinum AGI distribution in 2012 and 2022:
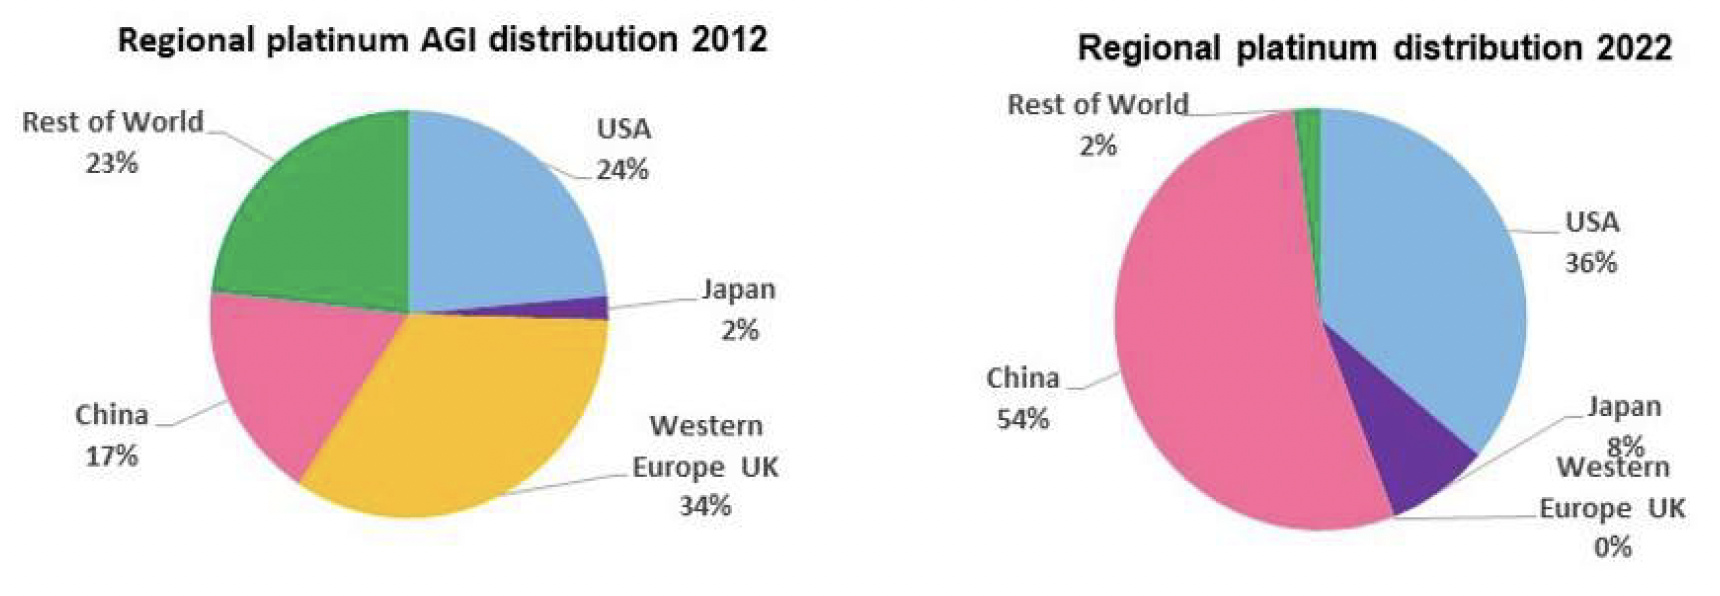
It is important to note that platinum AGIs are finite and in time will ultimately be unable to top-up metal supply in an environment of both increasing demand and price. I argue that the geographic location and mobility of vaulted stocks (AGI) is an important factor when considering the metal’s supply life and price. Platinum AGIs have entered this critical stage.
Result: Now the PGM industry, investors and others are aware of the regional distribution of platinum AGI’s.
The real-world of platinum market balance and regional distribution
In this conversation, I focus on illustrating graphically the real-world platinum market balance by region.
The USA
Real USA platinum market balance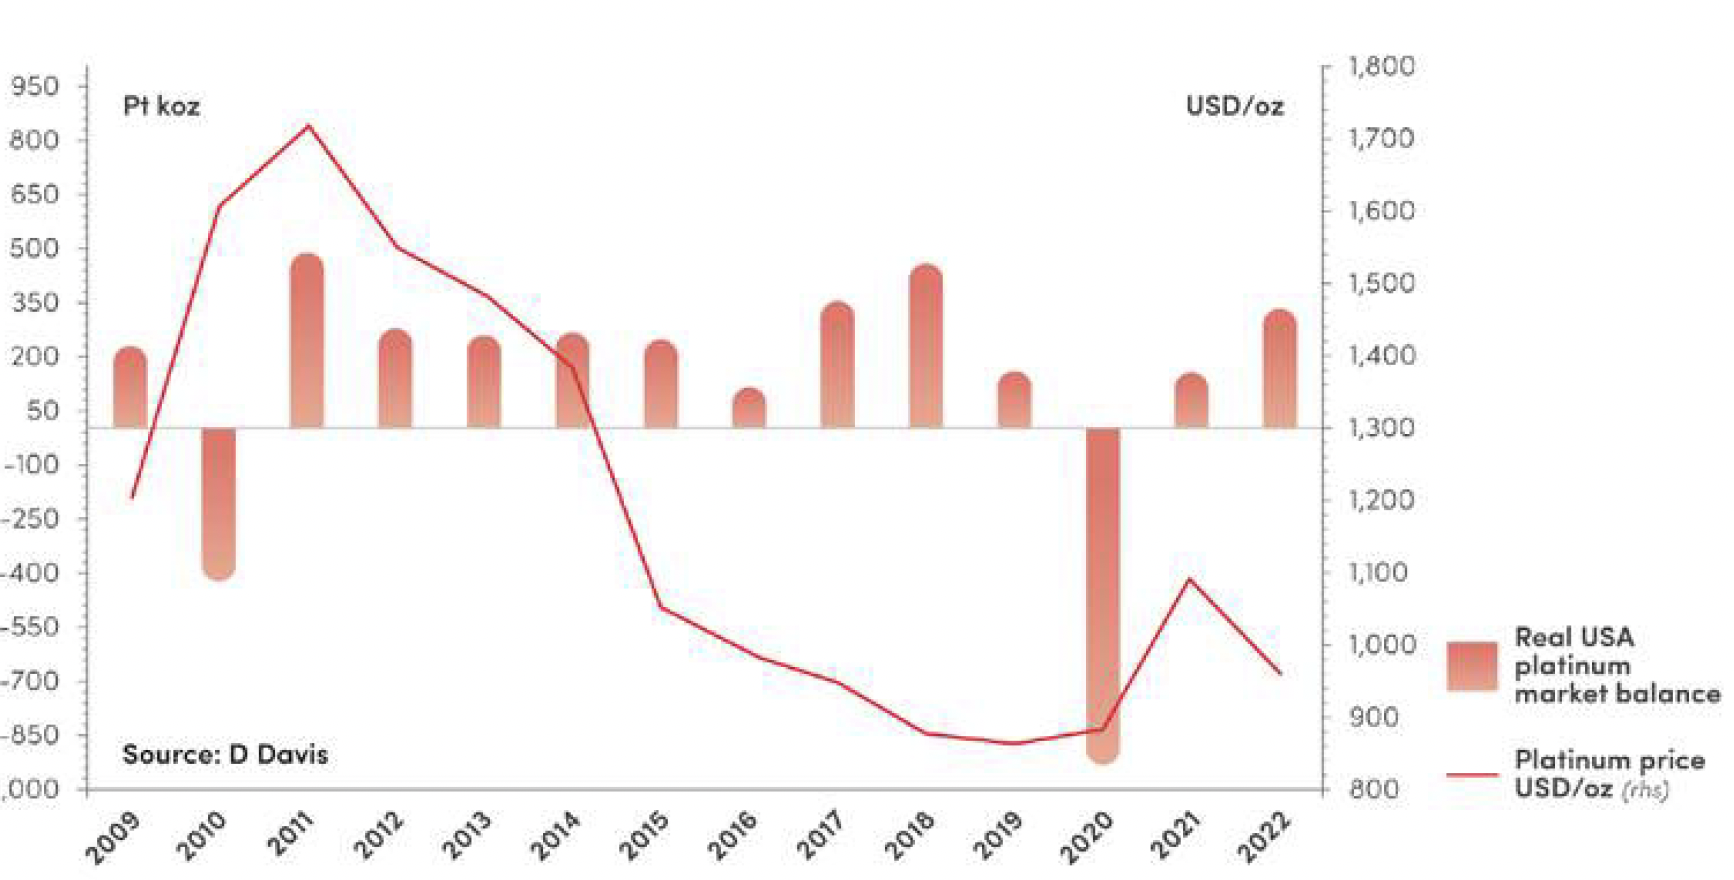
Japan
Real Japan platinum market balance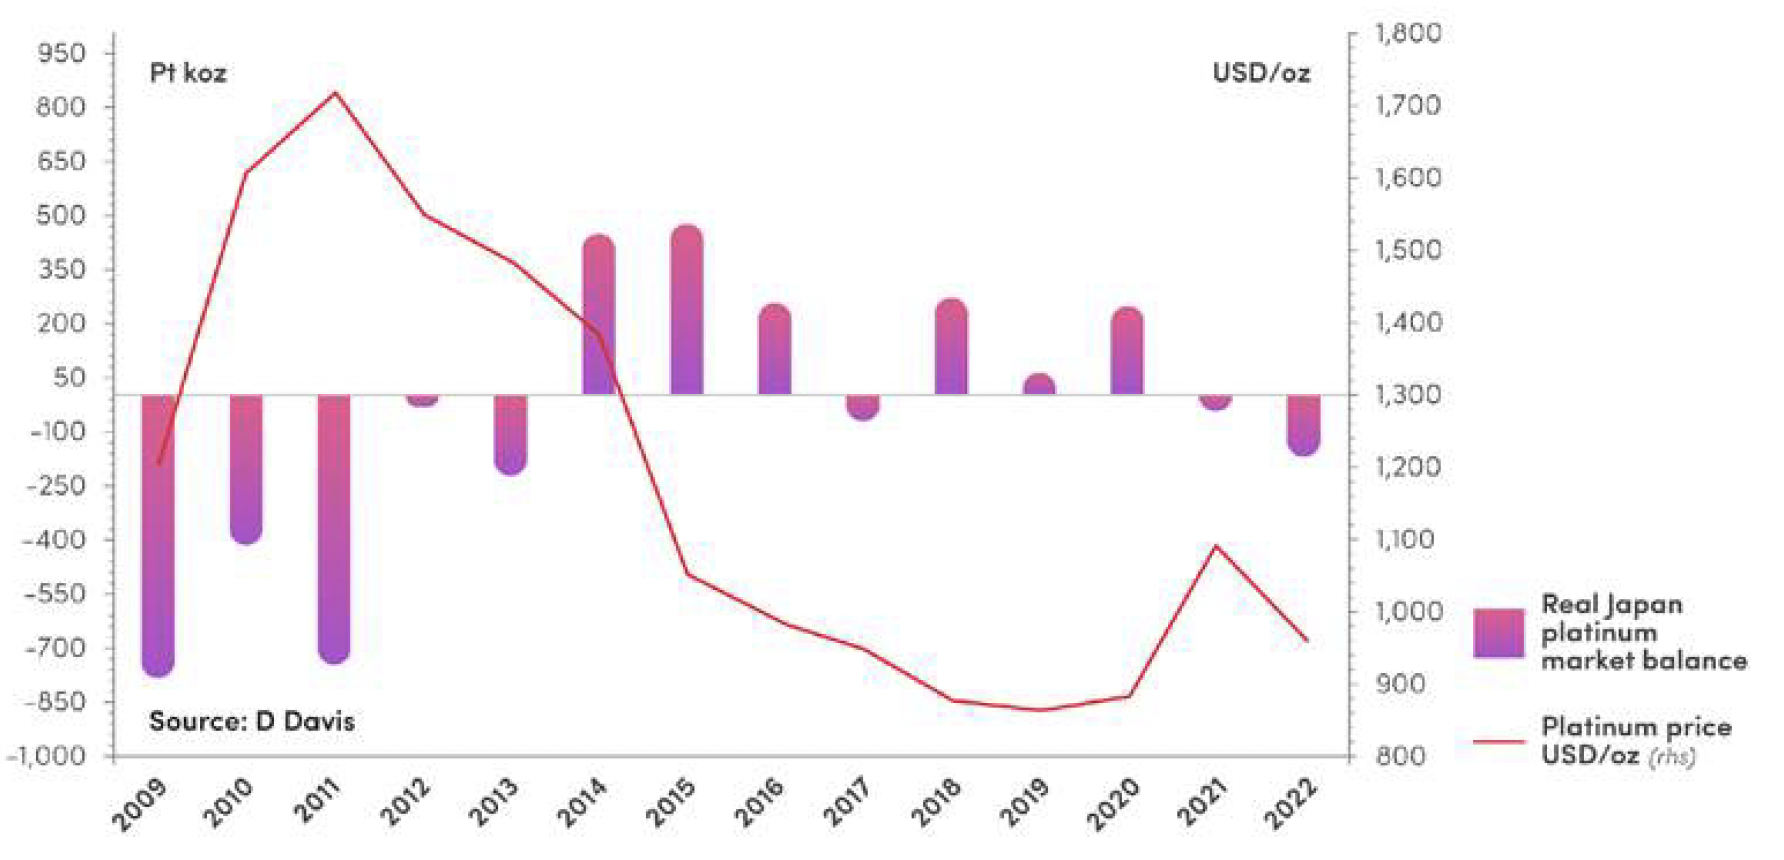
Western Europe UK
Real Western Europe platinum market balance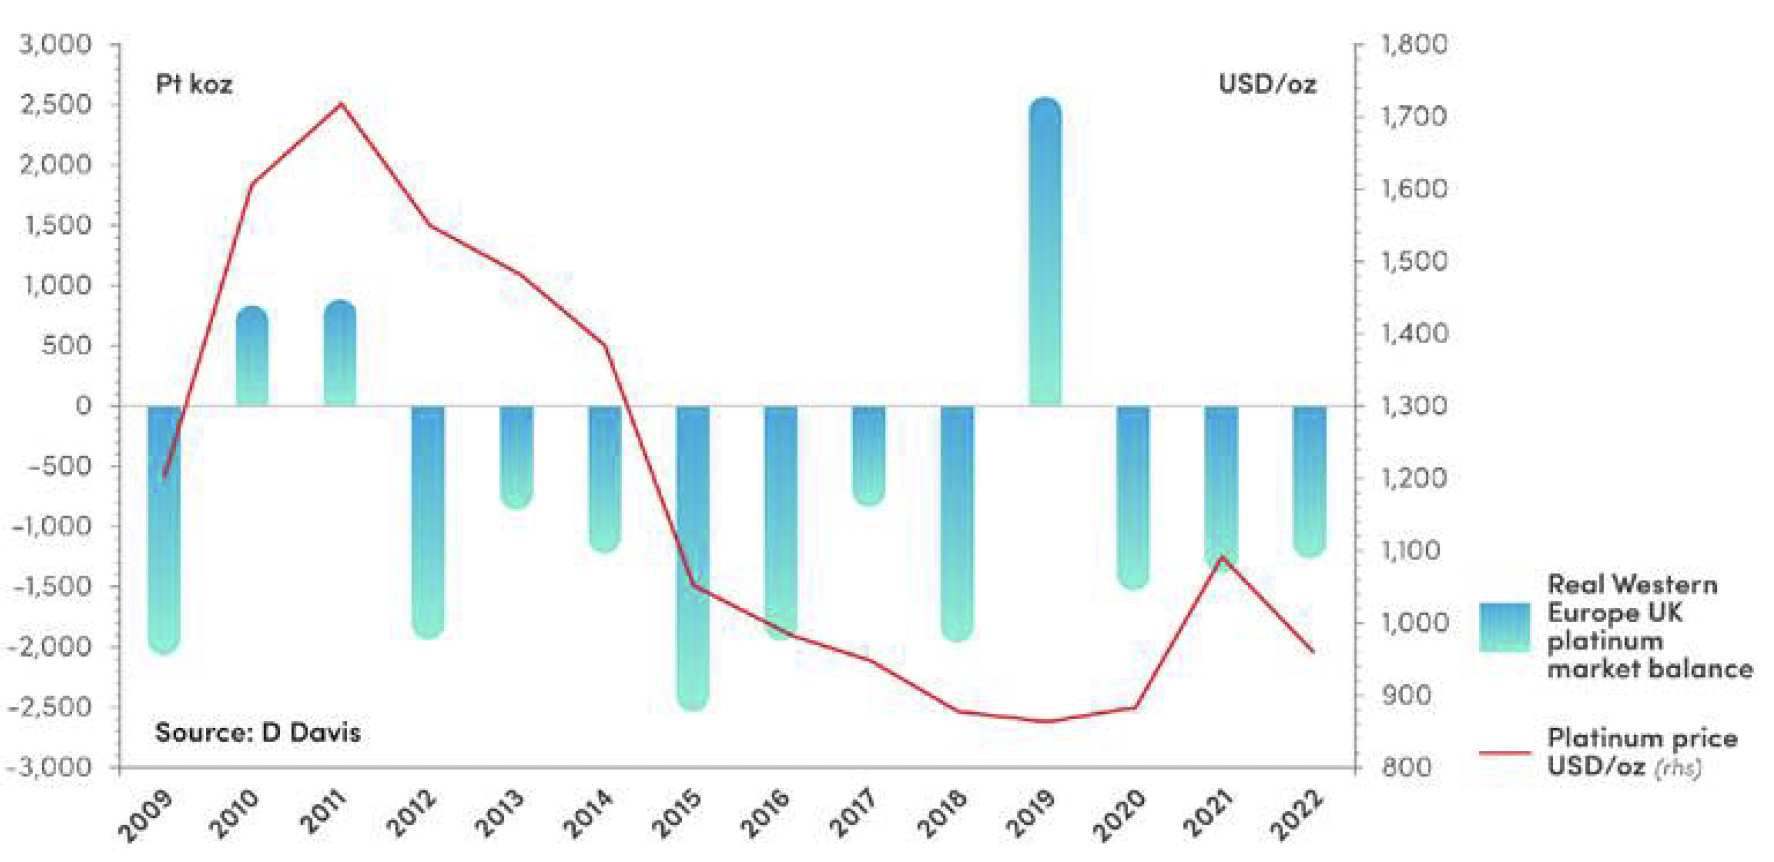
Rest of the World
Real Rest of the World platinum market balance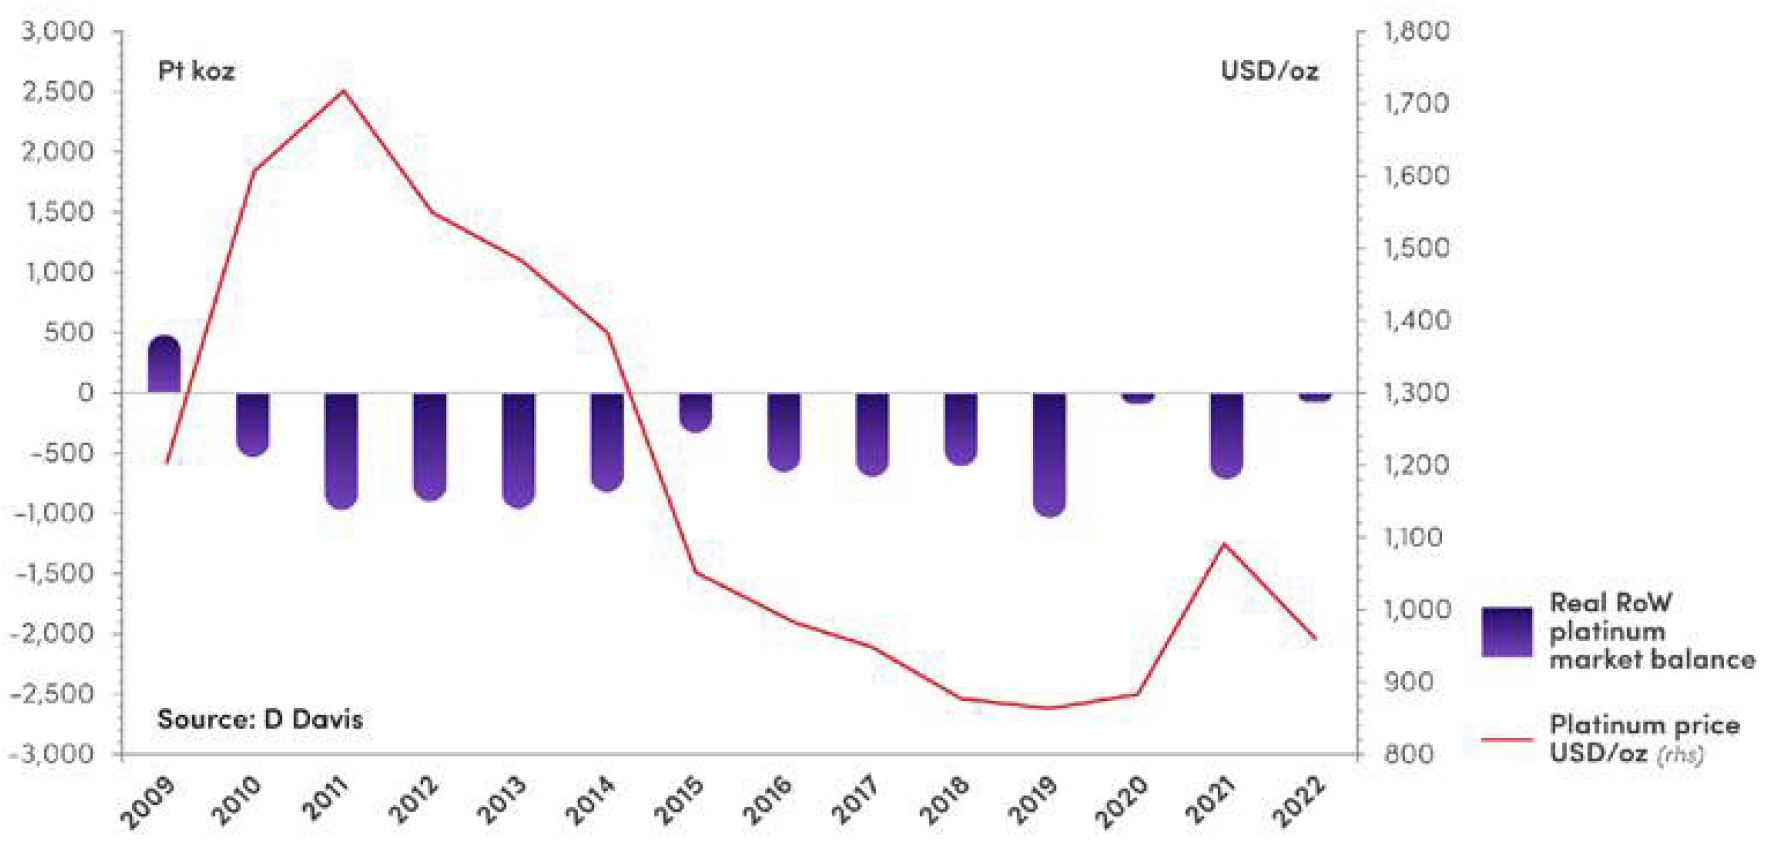
China
Real China platinum market balance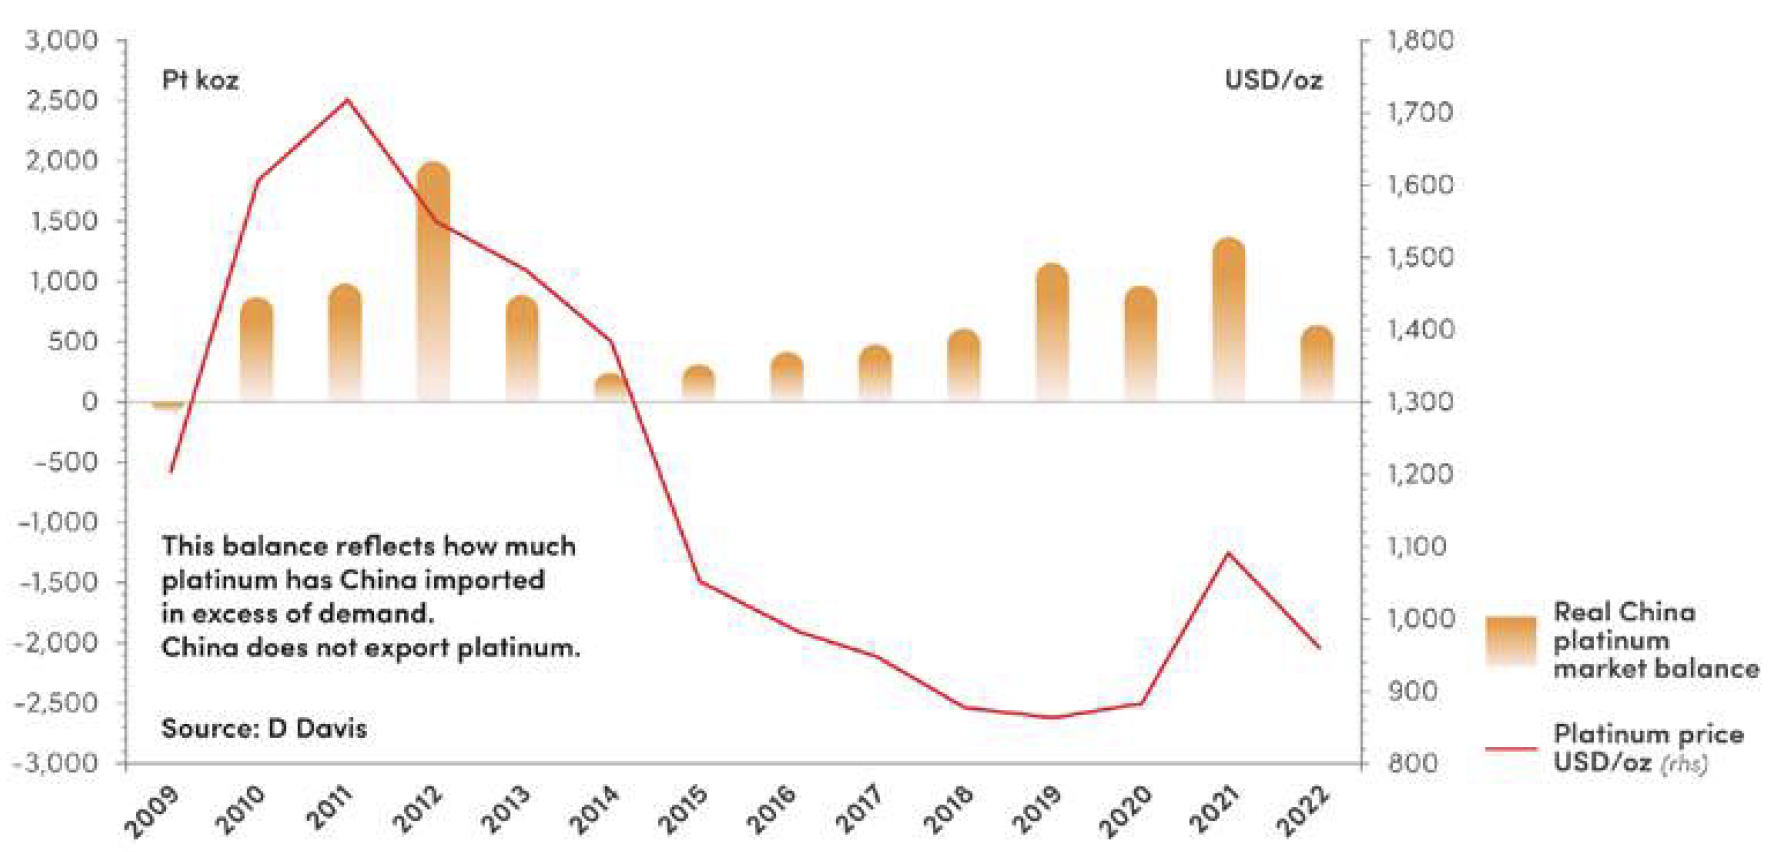
Global platinum
Comparison between the real global platinum market and the simple supply-demand market balance (including additional imports to China).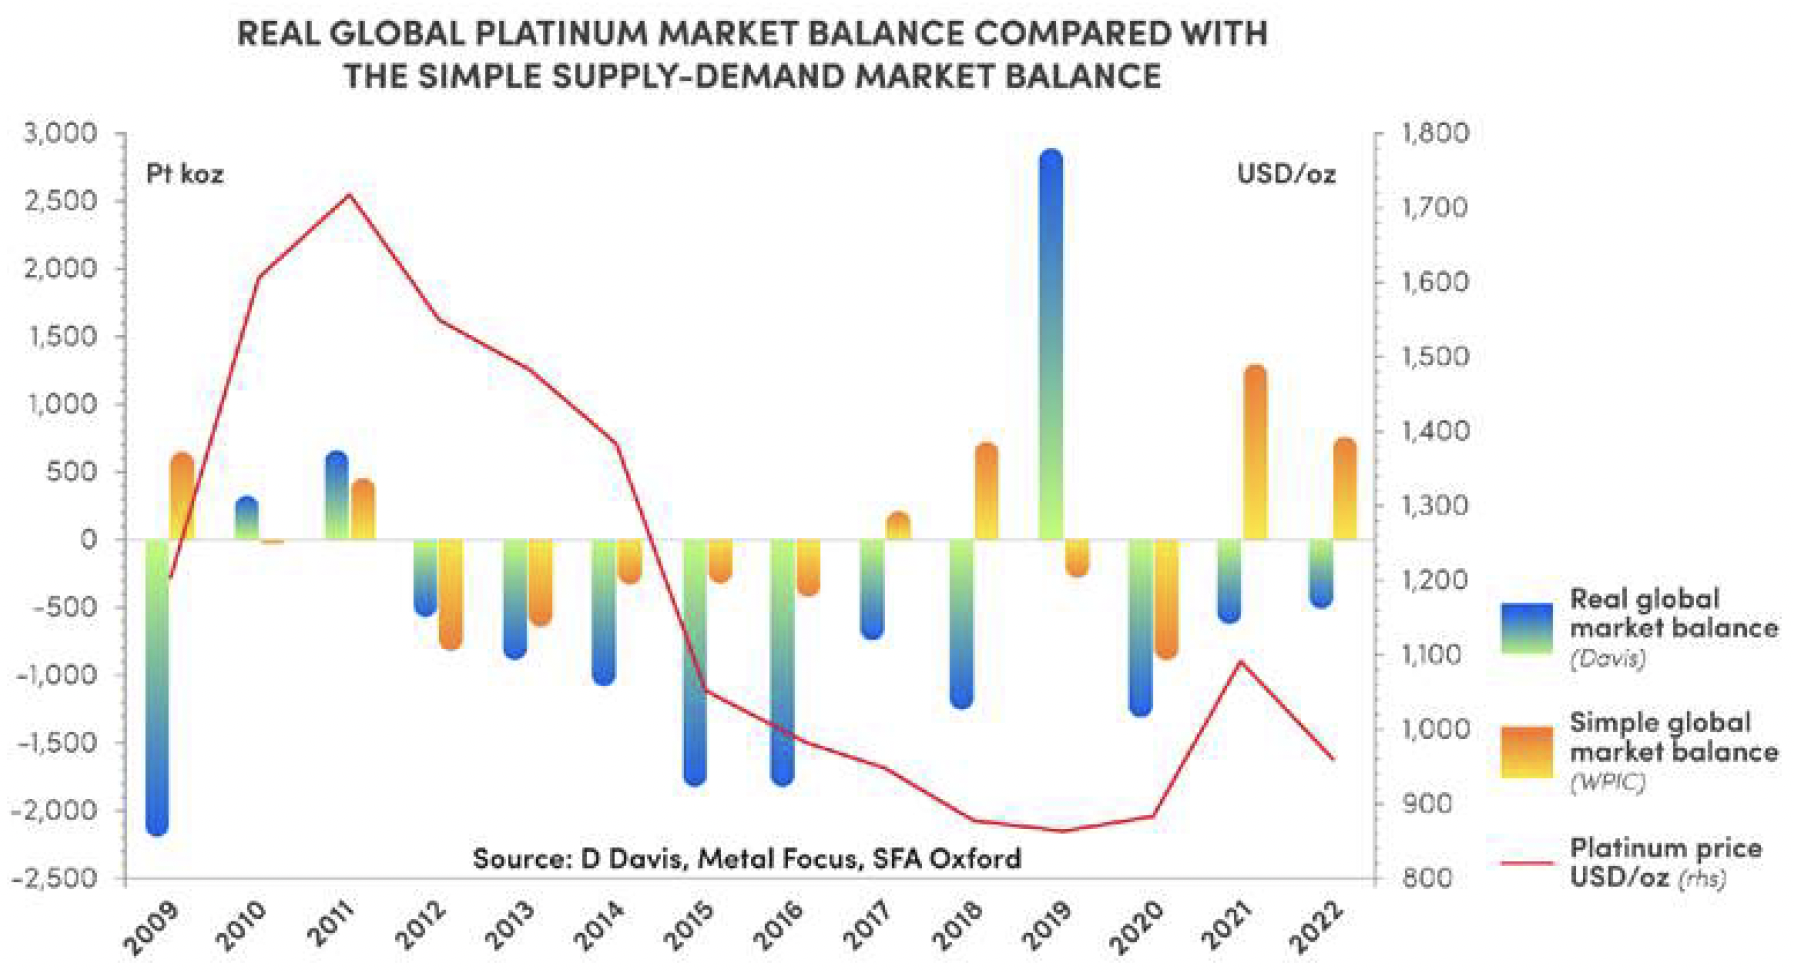
As I have indicated:
My Calculations imply that the platinum quantum of the AGI in Western Europe UK have entered a critical red zone. Support can only come from the USA AGI, at a price; from an increase in primary mine supply, which is in decline; and from a significant increase in recycling, which is unlikely, ceteris paribus. These trends are set to ignite the platinum price within the next few months.
CLICK HERE to download the full report